Category Archives: Barrier Reef Climate

Sea level Cooktown, Queensland, Australia

Mean sea level change at Cooktown, Great Barrier Reef, Queensland

Dr Bill Johnston

(scientist@bomwatch.com.au)

Main points

  • There is no evidence that melting glaciers, increasing levels of atmospheric CO2­­ or expansion of the oceans due to rising temperatures has caused sea levels to increase at Cooktown. Consequently, the likelihood that sea level will rise by 26 to 29 cm by 2030 as suggested by the IPCC is far-fetched.
  • As trends measured by multiple tide gauges adjacent to the reef differ from satellite-based estimates, and time-lapse aerial photographs since the 1950s show no shoreward encroachment of tidal wetting fronts, satellite data should not be used in critical studies or to inform government policy.
  • The El Niño Southern Oscillation exerts an overarching impact on fluctuations in sea level and other climate and environmental variables.

Background

The Great Barrier Reef Marine Park Authority (GBRMPA) claims that due to global warming, sea level is increasing and that the fastest rate of sea level rise is in the northern sector of the Reef. Further, the Intergovernmental Panel on Climate Change (IPCC) predicts sea level will rise by around 26 to 29 centimetres over the next 9-years (i.e., by 2030) and by 47 to 62 centimetres by 2080.

But is it true or is it just untrustworthy science?

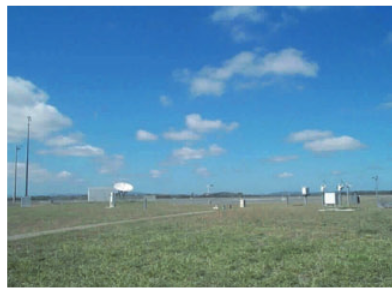
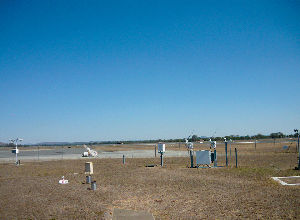
Rapid rates of sea level change should be evident in mean sea level (MSL) measured by tide gauges relative to the land, especially at Cooktown where Maritime Safety Queensland has operated an automatic tide gauge since January 1996 (Figure 1). Also, evidence of shoreline encroachment resulting from sea level rise should be obvious in time-series of aerial photographs available from Queensland Government archives since the 1950s and 1960s. 

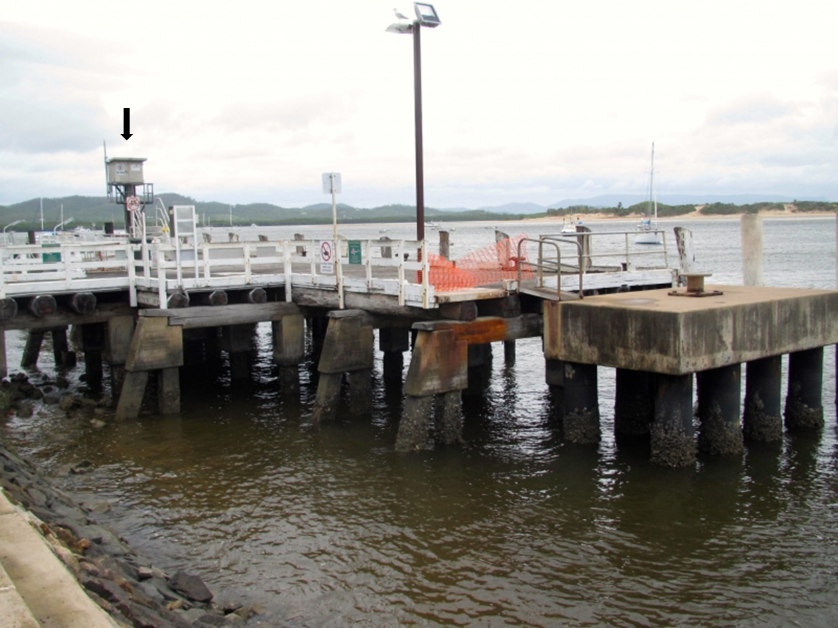
Figure 1. The Cooktown storm surge tide gauge (arrowed) located on the wooden-decked wharf prior to its restoration in 2015. (Photo 44740 from the Cultural Atlas of Australia.)  

What we did

High-frequency (10-minute) tide gauge data was downloaded from the Queensland Government Open Data portal, aggregated into monthly averages and analysed using a technique that partitioned variation IN the data caused by influential covariables, from underlying impact variables that impacted ON the data-stream.  

Aerial photographs taken in 1969, 1974, 1979, 1983, 1987, 1989, 1991, 1994 and high-definition Google Earth Pro Satellite imagery were also examined for signs of tidal encroachment at Cherry Tree Bay east of Cooktown across the peninsula.

What we found

The Bureau of Meteorology Southern Oscillation Index (SOI) was the most influential of a range of climate and environmental variables that affected MSL. Rainfall and rainfall two months previously (RainLag2) also explained a statistically significant but small portion of MSL variation. Having accounted for those covariables, extraneous factors impacting on the data-stream caused step-changes in 1997, 2009 and 2015.

Following Tropical Cyclone Justin in March 1997, a major dredging campaign removed 108,000 m3 of accumulated sediment from the harbour floor, which caused the wharf supporting the tide gauge to settle about 40 mm into the bed of the river by January 1998. Dredging of more sediment in 1999 (26,000 m3) did not affect the gauge. However, in March 2009 it settled a further 37 mm probably as a result of disturbances caused by TC Ellie (30 January to 4 February 2009) and TC Hamish (4 to 11 March 2009). The harbour was dredged again following TC Ita in 2014 (60,000 m3), then in January 2015 the former wooden wharf that supported the tide gauge was strengthened and re-decked with a new composite material capable of allowing small trucks to load and unload supplies (https://www.wagner.com.au/main/our-projects/cooktown-wharf/). Dredging and refurbishment caused the tide-gauge to settle a further 32 mm. Step-changes underlying the data-stream show the gauge is not well-secured to the harbour floor.

The highly significant step-changes (P <0.001) totalling 109 mm (SEM 9.4 mm) accounted for all the apparent MSL trend. There is no evidence therefore that sea level is rising in the northern sector of the Reef. The IPCC prediction that sea levels will increase globally by 26 to 29 cm by 2030 is an unlikely scenario.

A Queensland Government aerial photograph taken on 11 September 1969 was re-scaled and oriented so features across the peninsula east of Cooktown including the well-defined Cherry Tree Bay and associated rocky headlands can be directly compared as an overlay on a Google Earth Pro satellite image taken on 16 September 2018.

Marked where they intersect the headlands, tidal wetting fronts are the same along the low-gradient beach. Littoral zones around the headlands that define inter-tidal habitats also directly align. The same shoals and individual shore-line rocks, the small watercourse draining to the beach: all the same. There is no evidence of tidal encroachment and therefore no evidence that sea levels have materially changed over the intervening 49-years (Figure 2).

What we conclude      

Satellite data depended upon by IPCC do not stack-up with tide gauge data or aerial photographs taken between 1969 and 1994 compared with high-definition Google Earth Pro Satellite imagery of the same sandy-beach.

It seems that while CSIRO et al. can model sea level relative to some point at the centre of the earth with mm/year precision using satellites traversing the same patch of heaving ocean every 20-days or so, they and other oceanographers and elite climate scientists lack the skills to analyse tide gauge records or interpret aerial photographs they can freely download from the internet.     

Satellite data upon which speculation relating to sea level rise depends, is pre-loaded with trend and should not be used for critical studies, for spreading alarm or for informing government policy. It is a ridiculous notion that sea levels will increase by almost 300 mm during the next 9-years.

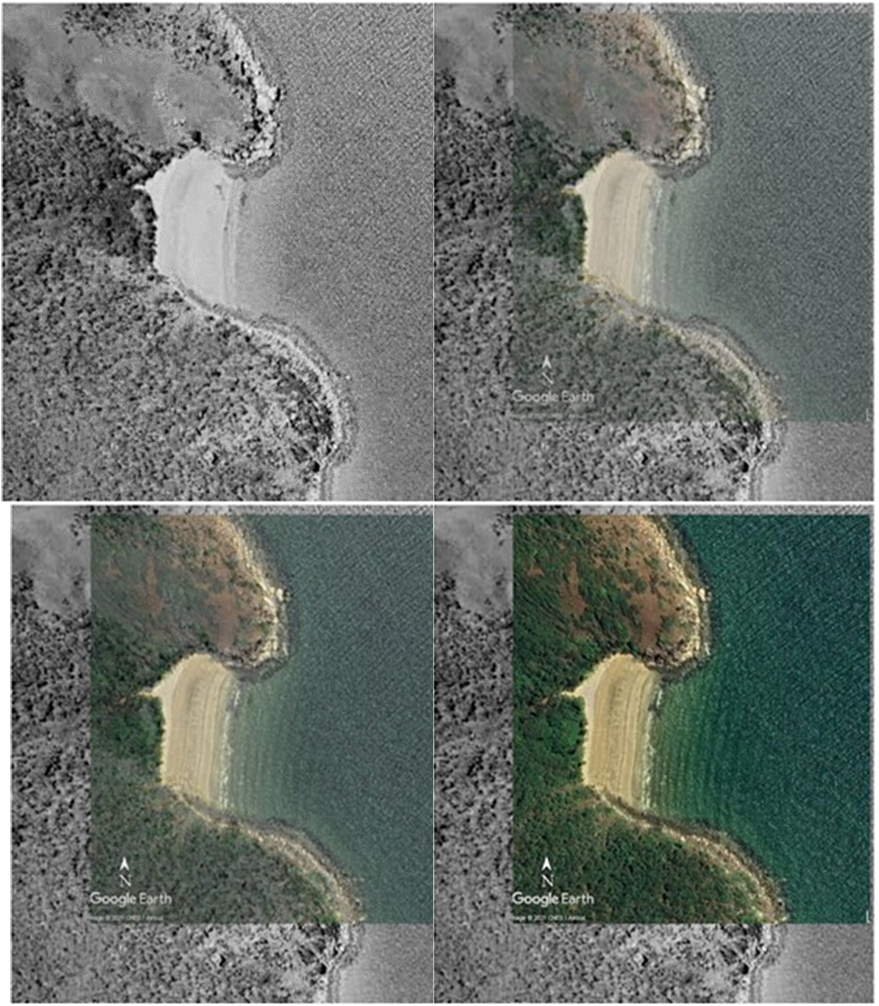
Figure 2. Aerial photograph of Cherry Tree Bay, east of Cooktown taken on 11 September 1969 overlaid on Google Earth Pro (GEP) Satellite image for 16 September 2018; upper-left, GEP opacity 0%, 50%; lower-left 75%, 100%. Tidal wetting fronts, littoral zones, rocks and shoals show no encroachment or change in exposure due to rising sea levels over the intervening 49-years.

Two important links – find out more

First Link: The page you have just read is the basic cover story for the full paper. If you are stimulated to find out more, please link through to the full paper – a scientific Report in downloadable pdf format. This Report contains far more detail including photographs, diagrams, graphs and data and will make compelling reading for those truly interested in the issue.

 Click here to download the full paper with photos graphs and data

Second Link: This link will take you to a downloadable Excel spreadsheet containing a vast number of Data points for the Cooktown tide gauge and which was used in the analysis of the sea level situation at Cooktown to support the Full Report.

Click here to access full table of data supporting the Full Report

Sea level Townsville, Queensland, Australia

Sea level at Townsville, Great Barrier Reef, Queensland

Dr. Bill Johnston[1]

http://www.bomwatch.com.au/

(scientist@bomwatch.com.au)

Main points

  • If melting of glaciers and icesheets in Greenland in recent decades significantly influenced mean sea level (MSL) it would be detectable in data for Cape Ferguson from 1991 and Townsville Harbour from 1959. However, there was no evidence that climate change, warming or melting ice sheets has caused sea levels to increase.
  • Tide gauges are affected by the conditions under which they operate. Data are coarse, imprecise, poorly documented and not understood by climate scientists and oceanographers who routinely conflate variation caused by covariates such as the El Niño Southern Oscillation, components of local water balances, and step-changes caused by site and instrument changes as being due to the climate.
  • In order to draw valid conclusions, it is imperative that scientists implement a quality assurance process that distinguishes between variables that cause variation IN data (covariables), from those that impact ON the data-stream (impact variables) and adjust for those using independent statistical methods.
  • Scores of peer reviewed papers published at great expense in elite scientific journals, by multiple authors supported by long reference lists are biased by lack of attention to detail and poor science. Using Cape Ferguson as a case study, and replicated using data for Townsville Harbour, the approach outlined here, which is widely applicable, sets a benchmark for undertaking due diligence on data. Findings of papers that failed to assess the fitness of data used to determine trend and change should be disregarded.

Background

Australia’s lead management agency for the Great Barrier Reef, the Great Barrier Reef Marine Park Authority (GBRMPA) states on their website that “global average sea level rose by 0.18 centimetres per year from 1961 to 2003. The total rise from 1901 to 2010 was 19 centimetres, which is larger than the average rate during the previous 2000 years.” (https://www.gbrmpa.gov.au/our-work/threats-to-the-reef/climate-change/sea-level-rise).

Further, they say that “Since 1959, records of sea levels for Townsville, in north Queensland, show an average increase of 1.2mm per year. However, the rate of increase may be accelerating, with records of sea levels at Cape Ferguson near Townsville showing an average increase of 2.9mm every year between 1991 and 2006.” How can it be that for the same waterbody, sea level is increasing 2.5 times faster just 25 km away from Townsville Harbour at Cape Ferguson?

GBRMPA goes on to claim that “because much of the land adjacent to the Great Barrier Reef is low-lying, small changes in sea level will mean greater erosion and land inundation. This will cause significant changes in tidal habitats, such as mangroves, and move saltwater into low-lying freshwater habitats. This will have flow-on effects for juvenile fish that use these habitats for protection and food resources.” So how can that be that compared with current satellite imagery aerial photographs from the 1950s and 1960s show wetting fronts on beaches and tidal influences on rocky headlands such as Cape Cleveland are unchanged?

Paid for by taxpayers, led by government agencies including CSIRO and the Bureau of Meteorology, ably assisted by the Australian Institute of Marine Science (AIMS) and barracked-on by slick campaigns run by WWF, the Climate Council, the Australian Museum, the Great Barrier Reef Foundation et al., Australians are bombarded by confusing, over-hyped mis-information and scare-campaigns related to the Great Barrier Reef.

Disaster-porn has replaced knowledge and understanding to the point that Australia’s climate history has been substantially re-written. Like a billion-dollar cart of hay put before the science-horse, in almost every sphere, policy-driven science has overtaken the scientific method.

Coupled with previous exposés that showed apparent trends in maximum temperatures at Cairns, Townsville and Rockhampton were caused by homogenisation adjustments and not the climate [LINK], this series of investigations examines monthly sea-level data measured at Cape Ferguson since September 1991 and the longer record for Townsville Harbour since January 1959. The aim is to independently verify that due to anthropogenic warming, survival of the Great Barrier Reef is imperilled by compounded multiple threats including sea-level rise. Of overriding concern is that on behalf of their ‘independent’ boards and sponsors, scientists may have been led astray by liberally-scattered golden-hay, and thereby lost pride in their scientific work.

What we did

Using the 30-year monthly MSL dataset for Cape Ferguson as a case study, we objectively distinguished between variables that cause variation IN tide-gauge data (covariables) from those that impacted ON the data-stream (impact variables). The approach outlined in the paper provides climate scientists and oceanographers with a method for verifying that data they use is fit for purpose i.e., that trend reflects the oceanographic waterbody and not covariables and/or effects caused by site and instrument changes. The Cape Ferguson study was replicated using the 62-year monthly dataset for Townsville Harbour.

Principle findings

  • At Cape Ferguson, 31.9% of variation in MSL was accounted for by (in order of importance), SOI3pt; barometric pressure (hPa); lag1 solar exposure (MJ/m2); Lag2 rainfall (mm), and current rainfall. Accounting for a step-change in 2009 caused by a change in calculating 10-minute values from 1‑second samples, and a residual 18.06-year cycle, increased R2adj to 0.645 (64.5%). Having removed variation IN the data and the effect of the inhomogeneity ON the data-stream, no trend or change was attributable to any latent factor such as melting glaciers and icecaps in Greenland, coal mining or global warming. 
  • The dataset for Townsville Harbour from January 1959, was nosier than Cape Ferguson, partly because data before 1984 were manually digitised from tide gauge charts and also because water levels in the harbour, which lies at the entrance to Ross Creek are greatly influenced by hydrological processes within the catchment, including urban development, irrigation, leakage etc. Thus, while SOI3pt was less influential, components of the water-balance (rainfall, evaporation and seasonality) were more so. Significant covariables accounted for 25.3% of variation in MSL.

Step-changes in residuals aligned with construction of the Ross River Dam in 1971 and its enlargement 2007. A third inhomogeneity in 1987 may have been associated with harbour developments or an undocumented change related to the gauge. Significant variables and step-changes together accounted for 49.2% of MSL variation.

  • Although MSL data were affected by random noise no residual trends or changes were due to any other systematic factor including warming of the climate or the ocean.

An important link – find out more

The page you have just read is the basic cover story for the full paper. If you are stimulated to find out more, please link through to the full paper – a scientific Report in downloadable pdf format. This Report contains far more detail including photographs, diagrams, graphs and data and will make compelling reading for those truly interested in the issue.

Click here to download the full paper with photos graphs and data 


[1] Former NSW Department of Natural Resources research scientist.

Sea Temp Townsville, Queensland, Australia

Trends in sea surface temperature at Townsville, Great Barrier Reef, Queensland

Dr. Bill Johnston[1]

http://www.bomwatch.com.au/

(scientist@bomwatch.com.au)

Main points

#1. Heat exchanges with the landscape bias trends in sea surface temperature (SST) measured close to shore such as at Cape Ferguson near Townsville (Latitude -19.2774o, Longitude 147.0586o), especially during periods of low summer rainfall when maximum temperature (Tmax) is axiomatically higher. Removing seasonal cycles, which show no trend, and accounting for the significant effect of terrestrial Tmax and barometric pressure (hPa), left no trend of change attributable to any other factor. While Tmax is clustered into dry-warm and moist-cool years, there is no evidence that SST has warmed since records commenced in September 1991.

#2. At Cape Ferguson SST cools more slowly from its peak in January to July than it warms from August to to December. Great Barrier Reef (GBR) ecosystems must therefore be adapted to the 8.1C interannual cycle and average month-to-month SST changes of up to 2C.

#3. Australian Institute of Marine Science (AIMS) SST data is short, patchy, poorly dispersed towards the extremities of the Reef and not useful for estimating trend. Selecting day-of-year averages for 27 sites extending from Thursday Island Cape York to North Solitary Island in the south showed Reef ecosystems are adapted to average temperatures between 27C to greater than 29C and greater than 30C for four to five months, and less than 20C in winter (July to September). Highest average SST is predicted to be 29.64C ( ±PI 1.12oC) at Latitude ‑13.5o in late January; SST cools slightly towards the equator.

#4. The Southern Equatorial Current which splits to form the North Queensland current and the East Australian Current (which dissipates south into the Tasman Sea) is cooled continuously by convection, long-wave re-radiation to space by towering clouds, cool rainfall and the formation of reflective residual cirrus ice-clouds. These processes maintain SST within close limits that rarely and only transiently exceed 30oC.

#5. No difference was found between temperatures measured between Port Stephens and Cape Sidmouth in November and December 1871 and data for those times derived from AIMS datasets. Further, data does not support claims by AIMS, the Great Barrier Reef Marine Park Authority, The Australian Museum, the Great Barrier Reef Foundation and groups including WWF and the Climate Council that sea surface temperature has increased by an unremarkable 0.8oC or that continued warming is likely to threaten survival of the Reef.

#6 Near the Equator the water cycle operates as a self-regulating heat-pump that catapults moisture high into the atmosphere to form cloud that reflects or rejects incoming solar energy during the monsoon and thereby limits input of warm waters to the North Queensland and East Australian currents. There is no evidence that the process has broken-down or is likely to break down in the future.

Background

With operations in Townsville, Darwin and Perth, AIMS is part of arguably the largest, most expensive and elite conglomerate of research institutions in Australia. Spread across multiple universities and state and commonwealth agencies and with strong support from the Australian Research Council, their research focuses on the effect of climate change on Australia’s Great Barrier Reef. They and partner organisations including CSIRO and the Great Barrier Reef Marine Park Authority (GBRMPA), Great Barrier Reef Foundation, WWF and the Climate Council have consistently claimed survival of the Reef is imperiled by rising seas and anthropogenic warming. For instance, GBRMPA states unequivocally[2] that “Australia’s climate has warmed on average by 1.44 degrees Celsius since national records began in 1910, with most warming occurring since 1950 and every decade since then being warmer than the ones before”; and that “sea surface temperatures in the Australian region have warmed by around 1 degree Celsius since 1910, with the Great Barrier Reef warming by 0.8 degrees Celsius in the same period”.

Research reported here investigates that claim. The main question is:

  • Is mean SST increasing, and if so, at what rate.

What we did

Using average SST data from September 1991 for the fixed tide gauge at Cape Ferguson, which is part of the Australian baseline Sea Level Monitoring Project run by Australia’s Bureau of Meteorology (BoM), we aimed to distinguish between variables that caused variation IN SST from latent factors that may have impacted ON the data-stream (impact variables). Multiple linear regression (MLR) was used to investigate variation IN SST, while factors that impacted ON the data-stream were investigated using step-change analysis of MLR residuals (SST with covariable effects removed). 

Commencing on 28 November 1871, SST was measured between Port Stephens and Cape Sidmouth near the top of Cape York by astronomers from Melbourne and Sydney who sailed on the Governor Blackall to observe the total eclipse of the sun and also on their return voyage commencing 13 December. They used bucket samples taken near the bow of the steamer each hour between 6 am and 6 pm each day. Data were summarised and coordinates were estimated from accompanying notes using Google Earth Pro. Although published in 1877, the data has never been used before to benchmark data collected more recently by AIMS. (National Library of Australia call number NL 551.56 R963.)

As AIMS data consisted of varying numbers of daily observations, collected using a variety of dataloggers and sensors over variable time periods, averages were calculated for 27 sites spanning the Reef corresponding to the time of the 1877 voyages and mainly at the start and middle of each calendar month. Datasets were analysed as transects using polynomial regression and compared statistically and graphically.

The Cape Ferguson, 1871 and derived AIMS SST datasets used in the study are available here .

Principal findings

Data measured close to shore was contaminated by heat transfers with the landscape. Thus, data for Cape Ferguson (and some AIMS dataloggers, notably several in Torres Strait) was warmer during dry hot summers and did not truly reflect SST.  

The Eastern Australian Current warms rapidly from November to December and temperature measured on the journey to Cape Sidmouth in 1871 was significantly cooler than values for the return voyage to Port Stephens. However, despite spatial and temporal uncertainties and within and between year variation in the behavior of the currents, confidence bands for AIMS data averaged for 01 and 15 November overlapped those for the voyage north from Port Stephens and were therefore not different. Within the Latitude limits of where datasets overlap, AIMS data for 04 and 18 December, 01 January and 15 and 01 February, are also not different to data for the return voyage from 13 to 24 December 1871.

Furthermore, toward its northern extremity (Bramble Cay, Latitude ‑9.08o, for which there is no useful AIMS data), while SST increases steadily from 01 November to mid-December, from then until March, SST does not exceed between 29o and 30oC. The curvilinear response evidenced an upper-limit to SST, which is rarely or only briefly exceeded.

Average monthly SST attains a plateau in late November that persists until the cooling phase commences in March. SST in the range 27oC to 29oC from November to late March provides a five-month growing season for corals, which combined with the minimum of around 20oC in July (North Keppel Island) defines the ecotone limit of Reef ecosystems.

North Solitary Island is too cool from September to April (<24oC) for Reef ecosystems to establish and thrive. It was estimated that at Latitude -13.5o , which was the warmest point along the Reef transect, maximum SST occurred in late January to early February (29.64oC ±PI 1.12oC ), the minimum occurred in mid-August (24.26oC ±PI 1.47oC), SST increased to mid-November (27.96oC ±PI 1.1oC) after which the cycle repeats. The interannual range was therefore about 5.4oC. Despite trend in sea-surface temperature being touted as a threatening process that may ‘catastrophically’ impact on the long-term health and survival of the Reef, of the scores of sampling sites operated by AIMS, only several are dispersed towards the extremities of the Reef, while too few are sufficiently well maintained and serviced to provide reliable long-term data.

Sea surface temperatures reported by AIMS are no warmer than they were in November and December 150 years ago in 1871. As solar radiation increases in summer, SST north of Latitude -13.5o is cooled by the monsoon and remains in the range of 29oC to 30oC. AIMS SST data shows no evidence that the process has broken-down or is likely to break down in the future.

As SST has not changed, nor is it likely to change in the future, coral bleaching is due to something else.

Find out more

The page you have just read is the basic cover story for the full paper. If you are stimulated to find out more, please link through to the full paper – a scientific Report in downloadable pdf format. This Report contains far more detail including photographs, diagrams, graphs and data and will make compelling reading for those truly interested in the issue.

Click here for the Full Report with analysis, graphs, tables and photos

[1] Former NSW Department of Natural Resources research scientist.

[2] https://www.gbrmpa.gov.au/our-work/threats-to-the-reef/climate-change/sea-temperature

Climate at Rockhampton, Queensland, Australia

Dr. Bill Johnston[1]

 Main Points

  • Aerial photographs and archived plans and documents unequivocally show the Stevenson screen at Rockhampton airport moved about 450 m from beside the northern boundary of the aerodrome to a mounded site south of the runways before May 1956. The move was not reported in site-summary or ACORN-SAT[2] metadata and the substantial change in exposure appeared to have been adjusted-out of the data using parallel observations that continued possibly until the 1960s.
  • A satellite communications unit (SatCom) installed within 25 m of the second site in 1986/87 caused maximum temperature to step-up 0.48oC. Also undocumented by metadata, the abrupt increase was ignored to imply it was due to the climate.
  • The cause of an upward step-change in 2013 (0.95oC) was not specifically identified. However, as it was not related to site changes or the climate, it was either due to a local instrument fault or a problem with off-site data processing. Everything considered, it could not be ruled out that recent data were manipulated so daily maximum temperatures appeared warmer by up to 2.2oC on warm days.
  • Adjusted for rainfall, site-related changes caused Tmax to warm 1.44oC overall and after step-changes and rainfall were accounted-for no unexplained changes or trends remained that could be attributed to the climate. 

Background

The Rockhampton airport weather station (ID 39083) is an Australian Climate Observations Reference Network – Surface Air Temperature site used to estimate Australia’s warming. As is the case for other ACORN-SAT sites, since the early 1990s when they commenced homogenising Australian temperature data, Bureau climate scientists have claimed repeatedly that site-histories used to pinpoint changepoints and make adjustments were exhaustively researched. However, to their discredit, like at Cairns and Townsville, they ignored that the original meteorological enclosure at Rockhampton (Figure 1) moved about 450 m south to a substantially different exposure before May 1956. Furthermore, it appears the effect on data was adjusted-out using parallel observations that continued possibly until the 1960s.

As if to blame the climate, Bureau scientists also ignored that a satellite communications module (SatCom) installed close to the second site in 1986/87 (Figure 2) caused mean annual maximum temperature (Tmax) to abruptly step-up 0.48oC from 1987.


Figure 1. (Left) The original Rockhampton weather station (met) was located was located on the northern boundary of the aerodrome behind the Aeradio office (mo), which was established by Amalgamated Wireless Australasia on behalf of the Civil Aviation Board in 1939. Other buildings shown in the May 1956 aerial photograph were H2, the hydrogen generator for filling balloons used to estimate windspeed and direction; (h) the pre-WWII hanger, (t) the terminal, (twr) tower and signal square (ss) used for visual communication. Although Bureau staff moved to the new control tower complex in 1961, the met-enclosure was still maintained until at least June 1966 (right).    

A step-change in 2013 (0.95oC) was not related to the climate but was caused by over-reporting of high-range daily values. The change appeared to have coincided with the AWS being hard-wired to the Bureau’s computers in Melbourne where data were processed into daily maxima, minima and 10-minute and half-hourly observations. As the Stevenson screen had been changed from 230 to 80-litres well before (on 22 March 2000) and no site changes were evident in satellite images; it was highly unlikely that while distributions of upper-range minimum temperatures (daily Tmin >18oC) were cooler after 2013, the highest 10% of daily observations (Tmax >33oC) were warmer by up to 2.2oC.

Further, while the record-highest temperature on 18 November 1990 (45.3oC) occurred before the site moved away from the SatCom and should be disregarded, it is implausible that the second highest value of 44.4oC on 28 November 2018 was 2.7oC over-range relative to the percentile distribution of pre-2013 data.

Although evidence was circumstantial, either the instrument, including its calibration was faulty or the problem occurred during processing. Given there were no parallel observations or a paper-trail, and bearing in-mind the Bureau’s penchant for declaring daily, monthly and annual ‘records’ somewhere almost every day, it cannot be ruled out that data were jigged higher on warm days.

Click here for full paper, photographs and tables of data.

Discussion

Moving a weather station is not a simple matter and it is not possible that the pre-1956 move was not recorded in Bureau files. It required negotiation with the Royal Australian Air Force and the Department of Civil Aviation; recommendations and approvals of expenditure at Director level; requisitions to the Department of Public Works (Cwth) for building the mound and installing equipment and it may have taken months to complete. Following the move parallel observations were made for several more years. Adding to the debacle, it appears data were changed to hide the move, which further undermines trust in the integrity of the Bureau’s data management processes.

Figure 2. An undated oblique view of the Rockhampton weather station and large SatCom dish copied from a 2011 ACORN-SAT Station catalogue (left); and (right) the same site from a different perspective copied from the most recent catalogue. Installation of the SatCom in 1986/87 caused maximum temperature to step-up 0.48oC.   

It is also not possible that observers were unaware that the SatCom was installed 20 to 30 m from the previous site in 1986/87 or that it generated heat that affected measurements. Also perverse is that the 1987 step-change, which was highly significant in both time and rainfall domains, was not detected or adjusted by data homogenisation. Likewise, multiple analyses of the 2013 step-change found it was due to either an instrument fault or off-site data processing, not the climate.

Despite at least four homogenisation iterations of the same data, failure to detect and adjust the 1987 step-change exposed major weaknesses in the Bureau’s methods. Homogenisation lacks scientific objectively, rigour and oversight; while picking and choosing changepoints and applying arbitrary adjustments allows changes and trends in homogenised data to be pre-determined.

Finally, at all levels (publication in scientific journals; the Bureau’s annual climate statements and reviews; CSIRO’s State of the Climate reports, supporting documents and advice to governments; grey-science news stories spread by the Climate Commission, the Conversation, the Climate Council, WWF and the ABC, in-house reviews and ‘independent’ technical audits) the peer-review process failed dismally to detect problems and biases.

Changepoint identification based on poorly researched and misleading metadata and application of arbitrary and inconsistent adjustments is neither credible nor scientific and should be abandoned.

An important link – find out more

Click here for full paper, photographs and tables of data.

The page you have just read is the basic cover story for the full paper. If you are stimulated to find out more, please link through to the full paper – a scientific Report in downloadable pdf format. This Report contains far more detail including photographs, diagrams, graphs and data and will make compelling reading for those truly interested in the issue.

Bill Johnston, 5 April 2020

Click here for full paper, photographs and tables of data.

[1] Dr. Bill Johnston’s scientific interests include agronomy, soil science, hydrology and climatology. With colleagues, he undertook daily weather observations from 1971 to 1979. 

[2] Australian Climate Observations Reference Network – Surface Air Temperature

Climate at Townsville, Queensland, Australia

Dr. Bill Johnston

Dr. Bill Johnston’s scientific interests include agronomy, soil science, hydrology and climatology. With colleagues, he undertook daily weather observations from 1971 to 1979.

Abstract

Main points

  • Aerial photographs and Royal Australian Air Force plans and documents held by the National Library and National Archives of Australia show the Stevenson screen at Townsville airport moved at least three, possibly four times before 1969 while it was on the eastern side of the main runway; and probably twice between when it moved to a mound on the western side in January 1970 and to the current automatic weather station site in December 1994.
  • Of those site changes, a site move in 1953/54 and another in 1970 resulted in step-changes in maximum temperature data that were unrelated to the climate. A step-change in minima in 1968 appeared to be due to nearby disturbances associated with building an extension to the met-office. Importantly, except in the Bureau’s Garbutt instruments file, which is online at the National Archives (Barcode 12879364), none of the relocations or nearby changes are listed or described in site-summary metadata.   
  • By ignoring prior changes and smoothing the 1994 transition to the automatic weather station and small (60-litre) Stevenson screen, homogenisation created trends in maximum and minimum temperature that had nothing to do with the climate. 
  • Accounting simultaneously for site-related changes and covariates (rainfall for Tmax and Tmax for Tmin) leaves no residual trend, change or cycles attributable to the climate. Thus there is no evidence that the climate has warmed or changed.

Background

Like many of Australia’s ACORN-SAT weather stations[1], the site at Townsville airport was set-up in 1939 as an Aeradio office for monitoring air-traffic and to provide advice of inclement weather along the east coast route between Melbourne and Port Moresby.

Changes in facilities, instruments and functions caused the site to move irregularly; however, moves and changes prior to December 1994 were not detailed in ACORN-SAT or site-summary metadata. Despite repeated assurances in peer-reviewed publications written by Bureau climate scientists and others, that the history of ACORN-SAT sites had been exhaustively researched and appropriate adjustments had been made for the effect of site changes on data, it was not the case at Cairns and neither is it true for Townsville.

As there is no measurable change or warming in temperature data for Townsville Airport, claims of catastrophic consequences for the Great Barrier Reef are unfounded in the temperature data and, as a consequence, are grossly overstated.

An important link – find out more

The page you have just read is the basic cover story for the full paper. If you are stimulated to find out more, please link through to the full paper – a scientific Report in downloadable pdf format. This Report contains far more detail including photographs, diagrams, graphs and data and will make compelling reading for those truly interested in the issue.

Click here to download the full paper including photographs and tables of data used.

Note: Line numbers are provided in the linked Report for the convenience of fact checkers and others wishing to provide comment. If these comments are of a highly technical nature, relating to precise Bomwatch protocols and statistical procedures, it is requested that you email Dr Bill Johnston directly at scientist@bomwatch.com.au referring to the line number relevant to your comment.   


[1] http://www.bom.gov.au/climate/change/acorn-sat/documents/ACORN-SAT-Station-Catalogue-2012-WEB.pdf

Cairns, Queensland, Australia

Dr. Bill Johnston

Dr. Bill Johnston ‘s scientific interests include agronomy, soil science, hydrology and climatology. With colleagues, he undertook daily weather observations from 1971 to 1979.

Abstract

Main points

  • Like many historical datasets, conditions affecting temperature measured at the Cairns post office are largely unknown. Site changes in 1900 and 1924 occurred in parallel with observations and an objective statistical method and post hoc attribution of changepoints as detailed previously for Gladstone Radar is preferable to relying on incomplete and possibly misleading metadata.
  • Metadata incorrectly specifies the location of the original aerodrome site near the 1939 Aeradio office and ignored the move to the mounded-site near the centre of the airport in 1966 and also that the site moved in September 1983 out of the way of a new taxiway. During construction when neither site was operational, aerial photographs show a fourth site was established near the location of the current automatic weather station. Data from that site either in-filled the record or were used to adjust for the 1983 move. A highly significant step-change in 1986 plausibly marked when in-filling or adjustments ceased.
  • Rainfall reduced Tmax 0.033oC/100 mm and together with site changes accounted for 53.7% of Tmax variation. Step-changes at the post office in 1900, 1924 and 1929 and at the airport in 1986 caused 1.01oC of warming in the data and there is no residual trend or change attributable to the climate.

Background

Cairns is located in northern Queensland and is the main tourist-hub for visitors to Port Douglas, the wet-tropics hinterland and the northern Great Barrier Reef (GBR). It is often in the news that survival of the GBR is threatened by climate change warming and following a coordinated ‘save the reef’ campaign in April 2018 the Great Barrier Reef Foundation was gifted almost $0.5b by then Prime Minister Malcolm Turnbull. While WWF and related entities including AYCC, GetUp! and the Climate Council continuously bang the same drum, the question remains: to what extent is the climate of the GBR changing or warming?

The best way to find out is to grab some data, undertake research and find out what is going-on.

Merged in October 1942, one hundred and twenty years of post office and airport data showed no evidence that the climate at Cairns has changed or warmed. No marked increases have occurred in the frequency of maximum temperature extremes and nothing suggests temperature is likely to increase markedly in the future.

Being a whole-of-government enterprise, climate change and warming has been created by Bureau of Meteorology scientists who ignored site changes that happened and adjusted for some that didn’t to cause warming in homogenised data that doesn’t exist. ACORN-SAT metadata claimed the only move at the airport was in December 1992 when the “site moved 1.5 km northwest (to the other side of the runway)”; which isn’t true. Picked-up by the ABC, The Conversation, Guardian, the former Fairfax press; numerous web-sites and professors dependent on funding from the Australian Research Council; it has all rested on an extremely dubious, and superficial, level of statistical analysis. It must surely be deeply concerning to any competent statistical analyst that the Bureau of Meteorology BOM) has only the most rudimentary knowledge of site changes at Cairns – site changes that have created significant step changes in the data. Exhaustive research into historical Public Works records reveals significant site changes affecting the temperature record at Cairns.

It is of concern that so much money has fallen out of the sky to address a problem that cannot be confirmed by a rigorous analysis of the data.         

An important link – find out more

The page you have just read is the basic cover story for the full paper. If you are stimulated to find out more, please link through to the full paper – a scientific Report in downloadable pdf format. This Report contains far more detail including photographs, diagrams, graphs and data and will make compelling reading for those truly interested in the issue.

Click here to download the full paper including photographs and tables of data used.

Note: Line numbers are provided in the linked Report for the convenience of fact checkers and others wishing to provide comment. If these comments are of a highly technical nature, relating to precise Bomwatch protocols and statistical procedures, it is requested that you email Dr Bill Johnston directly at scientist@bomwatch.com.au referring to the line number relevant to your comment.   

[1] Dr. Bill Johnston’s scientific interests include agronomy, soil science, hydrology and climatology. With colleagues, he undertook daily weather observations between 1971 and 1979.

Methods Case Study, Gladstone, Queensland, Australia

Dr Bill Johnston [1]

Dr. Bill Johnston’s scientific interests include agronomy, soil science, hydrology and climatology. With colleagues, he undertook daily weather observations from 1971 to 1979.

Abstract

Main Points

  • The weather station at Gladstone Radar marks the approximate southern extremity of the Great Barrier Reef.
  • Temperature and rainfall data are used to case study an objective method of analysing trend and changes in temperature data.
  • The 3-stage approach combines covariance and step-change analysis to resolve site change and covariable effects simultaneously and is widely applicable across Australia’s climate-monitoring network.
  • Accounting for site and instrument changes leaves no residual trend or change in Gladstone’s climate.

Background

In Part 1 of this series, temperature and rainfall data for Gladstone Radar (Bureau of Meteorology (BoM) site 39326) are used to case-study a covariate approach to analysing temperature data that does not rely on comparisons with neighbouring sites whose data may be faulty.

Advantages of the method are:

  • The approach is based on physical principles and is transparent, objective and reproducible across sites.
  • Temperature data are not analysed as time-series in the first instance, which side steps the problem of confounding between serial site changes and the signal of interest.
  • Changes in data that are unrelated to the causal covariate are identified statistically and cross-referenced where possible to independent sources such as aerial photographs and archived plans and documents. Thus the process can’t be manipulated to achieve per-determined trends.
  • The effect of site-changes and other inhomogeneties are verified statistically in the covariate domain. Thus the approach is objective and reproducible.
  • Covariate-adjusted data are tested for trend and other systematic signals in the time-domain.

Further, statistical parameters such as significance of the overall fit (Preg), variation explained R2adj and significances of coefficients provide an independent overview of data quality.

An important link – find out more

The page you have just read is the basic cover story for the full paper. If you are stimulated to find out more, please link through to the full paper – a scientific Report in downloadable pdf format. This Report contains far more detail including photographs, diagrams, graphs and data and will make compelling reading for those truly interested in the issue.

click here to download the full case study including photographs and tables of data used.

Note: Line numbers are provided in the linked Report for the convenience of fact checkers and others wishing to provide comment. If these comments are of a highly technical nature, relating to precise Bomwatch protocols and statistical procedures, it is requested that you email Dr Bill Johnston directly at scientist@bomwatch.com.au referring to the line number relevant to your comment.   

[1] Dr. Bill Johnston’s scientific interests include agronomy, soil science, hydrology and climatology. With colleagues, he undertook daily weather observations from 1971 to 1979.