Tennant Creek NT [BoM ID 015135 (airport), 015087 (post office); joined 1 November 1970] Temperature data from February 1910 to December 2022.
Is homogenisation of Australian temperature data any good?
Dr Bill Johnston, former research scientist, NSW Department of Natural Resources
www.bomwatch.com.au
Protocols, which are essentially a description of the research question (hypothesis) and the means by which it would be addressed, lie at the heart of the scientific method. This report outlines the basis for, and steps involved in undertaking unbiased analysis of trend and change in Australian maximum temperature (Tmax) datasets using Tennant Creek as the case study.
Based on the First Law of Thermodynamics, BomWatch protocols are transparent, objective and replicable and provide a firm baseis for assessing trend and change in maximum temperature datasets and for resolving issues related to the Bureau of Meteorology’s homogenisation of the same data.
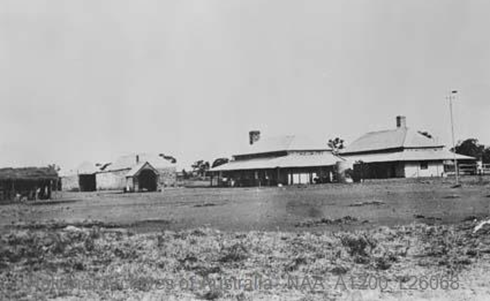
The Tennant Creek Telegraph station in 1872, showing a wind vane and Stevenson screen on the far right of the photograph (National Archives of Australia Item ID: 11774998). As the site was close to buildings, it was probably watered by bucket or watering-can during the seasonal ‘dry’.
Summary
The case study concluded that step-changes related to site changes caused Tmax to increase 1.51oC between 1910 and 2022 independently of rainfall, and that site-changes and rainfall simultaneously explained 73.8% of Tmax variation. Post hoc analysis found no residual trend or change was attributable to any other factor including CO2, coalmining, electricity generation or anything else.
Homogenisation cooled pre-1935 and pre-1963 Tmax to varying extents and achieved trends approaching 0.15oC/decade. Australian Climate Observations Reference Network – Surface Air Temperature V.2.4 also adjusted data higher from 1999 to 2015 by 0.52oC thereby smoothing the effect of post-2013 site changes so they appeared to be due to the climate. However, while trend became more significant and goodness-of-fit improved, variation in Tmax explained by rainfall declined from 46.3% initially, to 16.5% for ACORN-SATv.2.4.
Maps, plans, aerial photographs and satellite images show unequivocally that trend in Tmax data was mostly due to spraying out the grass and replacing the former 230-litre Stevenson screen in 2012, and installing a wind-profiler array within 45m of the screen before March 2013.
Bomwatch protocols
BomWatch protocols comprise four elements, namely:
· The overall relationship between Tmax and rainfall partitions total variation into that due to rainfall, and the residual non-rainfall part. Linear regression also derives the overall Tmax/rainfall coefficient, and significance (P) and goodness of fit (R2adj) statistics that indicate conformity with the First Law of Thermodynamics.
· Homogeneity analysis of rescaled residuals identifies non-climate impacts on data, which are categorised as step-change or (Sh)ift scenarios
· Segment-by-segment analysis with rainfall detects outliers, lack of fit, and other potential problems, and,
· Categorical multiple linear regression (and interaction analysis) finalises and verifies outcomes.
Segmented trend and graphical analysis confirm and verify that relationships are linear, residuals are normally distributed, independent, with constant variance, and that they are timewise homogeneous.
Based on the First Law Theorem that maximum temperature depends on rainfall, BomWatch protocols provide an unequivocable basis for understanding the effect of non-climate impacts on data, and for objectively assessing the BoM’s homogenisation methods.
Is homogenisation of Australian temperature data any good?
Is homogenisation of Australian temperature data any good?
Part 7b. Timber Creek, Northern Territory, Australia
Bureau of Meteorology ID 14850, Latitude -15.6614 Longitude 130.4808.
Dr Bill Johnston
scientist@bomwatch.com.au
Summary
Data quality is poor. The use of faulty data that are not homogeneous, to adjust faults in ACORN-SAT data is unscientific and likely to result in biased outcomes. As the ACORN-SAT project does not ensure comparator datasets are homogeneous, it is deeply flawed and should be abandoned. Read on …
The quality of Tmax data for Timber Creek is exceptionally poor. Its use for adjusting faults in ACORN-SAT data is highly questionable. Data are affected by missing daily data, poor site-control and the probable replacement of a 230-litre Stevenson screen with a 60-litre one around 1996. Although data lack precision, accounting for rainfall and the up-step in 1996 left no residual variation attributable to CO2, coalmining, electricity generation or anything else.
Background
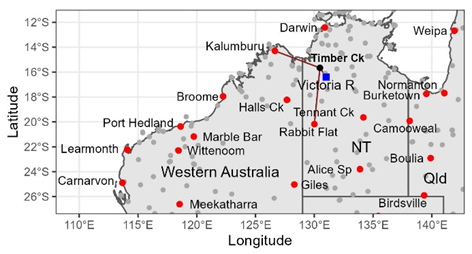
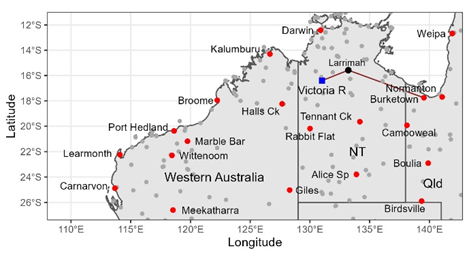
The isolated town of Timber Creek is located beside the Victoria River, on the Victoria Highway, 600km south of Darwin and 280m southwest of Katherine in the Northern Territory (Figure 1). The Victoria River flows west to the Joseph Bonaparte Gulf close to the Western Australia – Northern Territory border. Daily maximum temperature (Tmax) data is available from the Bureau of Meteorology (BoM) from 23 January 1961, to when the station closed on 5 September 2014.
Figure 1. Timber Creek and other weather stations having more than 10-years of records (grey points), and Victoria River Downs (blue) and other ACORN-SAT sites in northern Australia (red buttons).
Tmax data for Timber Creek was used to adjust ACORN-SAT sites at Victoria River Downs, Kalumburu, and Rabbit Flat (Table 1). So, is Tmax data for Timber Creek any good?
Table 1. ACORN-SAT sites adjusted at the dates indicated using Tmax data for Timber Creek.
ACORN-SAT site: (Distance to Timber Ck.)
Vic. River Downs (ID 14825) (106km)
Kalumburu (ID 1019) (434km)
Rabbit Flat (ID 15666) (509km)
Adjust dates AcV1 (2009)
1 Aug 1987
1 Jan 1986 23 Aug 1991
Nil
Adjust dates AcV2.1 (2020)
Nil
1 Jan 1986 23 Aug 1991
1 March 1997
Adjust Dates AcV2.3 (2023)
Nil
1 Jan 1986 23 Aug 1991
1 March 1997
Methods
Daily temperature and monthly rainfall were downloaded from the Bureau of Meteorology, Climate Data Online facility (Climate Data Online – Map search (bom.gov.au)). Monthly rainfall was infilled as necessary using data for the nearest available site and flagged for reference. Data were summarised into an annual dataset (Timber Creek.xlsx) and analysed using the same BomWatch protocols described previously in the Parafield case study1 and subsequent reports, including for Victoria River Downs2 of which this report is a subset.
Only maximum temperature (Tmax) data were analysed.
Results
Missing daily observations may have affected mean annual Tmax in 1987, 2008 and 2013 (N <346 observations/year); however, influence plots did not suggest those years were outliers. Outlier years which were identified (but also not omitted) were 1998, 2005 and 2013. Observations appeared to become lackadaisical after 2006. No other attributes of the data were remarkable.
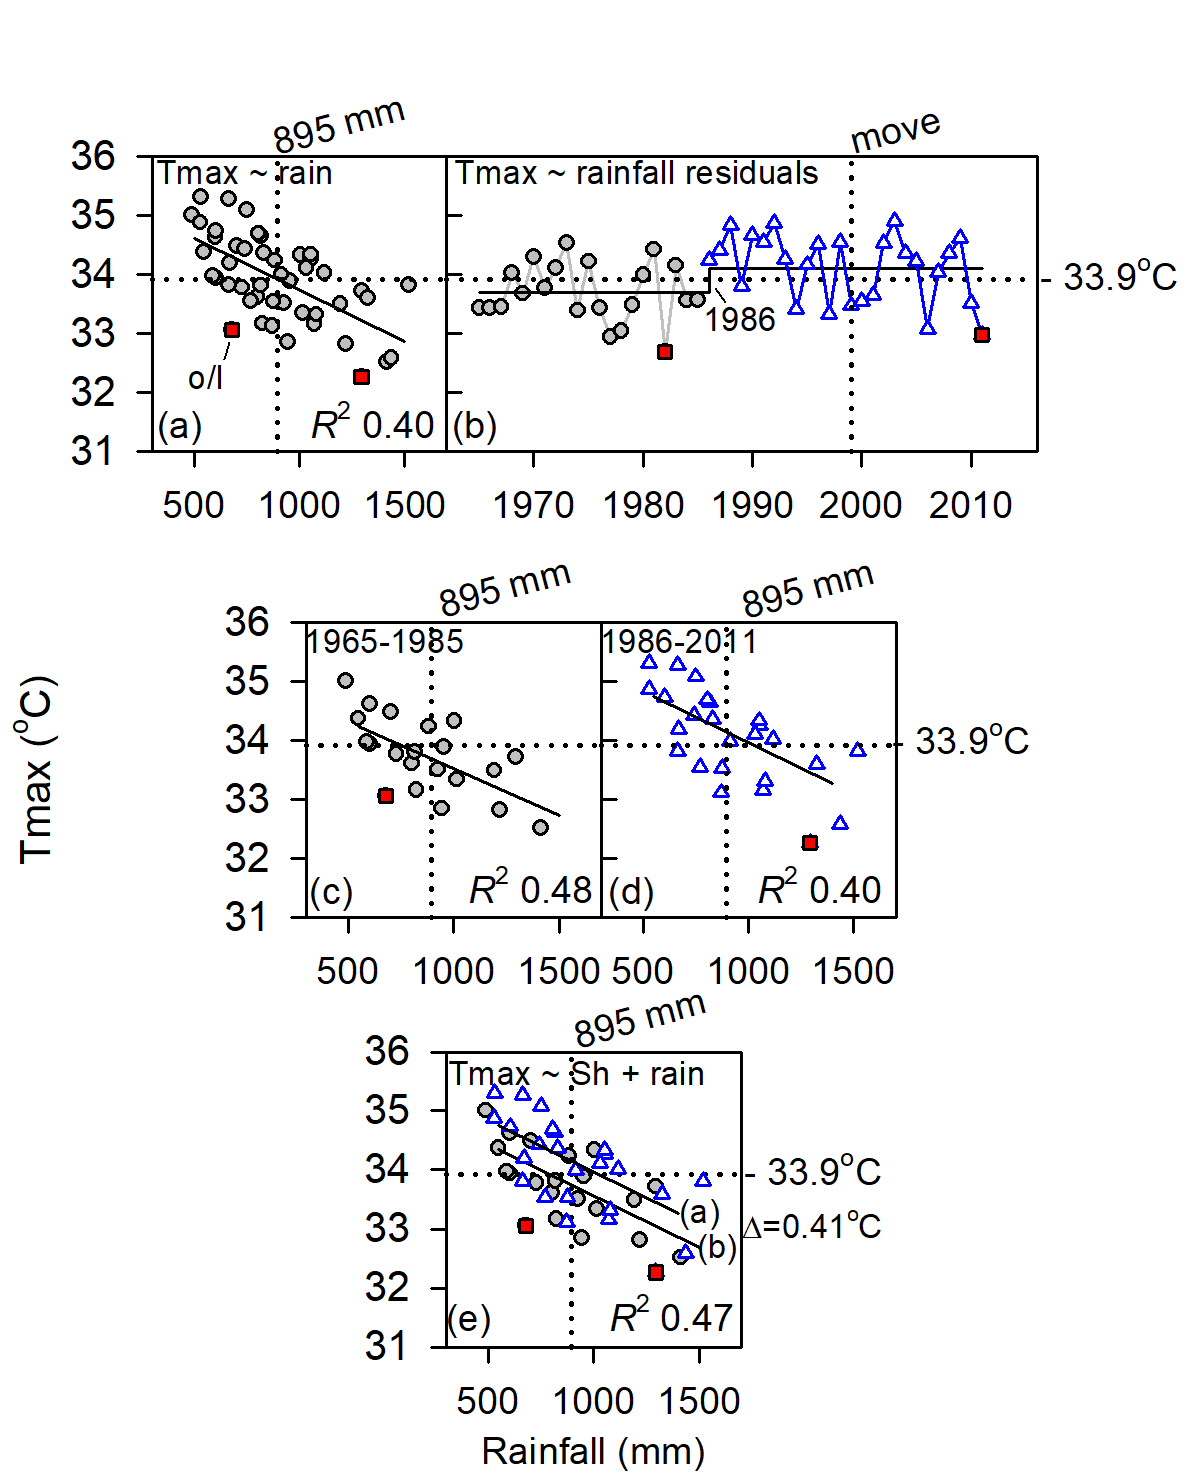
Rainfall, which is the deterministic portion of the Tmax signal explained 27.0% of Tmax variation (Figure 2(a)), which is low relative to the BomWatch benchmark of R2adj = 0.50. Either data quality is exceedingly poor, or an influential variable has not been accounted for by the naïve Tmax ~ rainfall case (Table 1(i)).
(Note: R2adj calculated by the statistical package R, adjusts variation explained for the number of terms in the linear model, as well as for the number of observations3. It is therefore more robust (less biased) than unadjusted R2 calculated by spreadsheet programs such as Excel.)
Figure 2. Composite analysis of Timber Creek Tmax.
Inhomogeneities in rescaled Tmax ~ rainfall residuals were evaluated using STARS, which objectively tests whether the mean of subsequent values is significantly different (P<0.05) to that before, using a running t-test of the difference.
Indicated by the horizontal line in Figure 2(b), STARS detected an up-step of 0.47oC in 1996 (P = 0.003). Segments defined by the step-change were examined separately in Figure 2(c) and Figure 2(d) and Table 1(ii).
Categorical multiple linear regression (Table 1(iii)) showed rainfall reduces Tmax 0.175oC/100mm, and that segmented regressions were offset by a rainfall-adjusted difference of 0.58oC (Figure 2(e)), which is within range of that detected by STARS.
Post hoc tests (Table 1(iv)), confirmed that data consisted of two non-trending segments interrupted by the step-change in 1996.
Although data lack precision (R2adj <0.50, Table 1(iii)), accounting for rainfall and the step change in 1996, left no residual variation attributable to CO2, coalmining, electricity generation or anything else.
Table 1. Statistical summary. RSS refers to residual sum of squares. Partial R-square (R2partial) estimates the proportion of variation explained by the Sh(ift)factor that is not explained by rainfall alone (calculated as: [(RSSfull – RSSrain)/ RSSfull)*100].
(1) Letters in parenthesis indicate differences between means (2) No outliers
Discussion
Relationships between Tmax and rainfall (Table 1) show shows the quality of Tmax data for Timber Creek is exceptionally poor, which raises the question why would it be used to adjust ACORN-SAT sites at Victoria River Downs, Kalumburu, and Rabbit Flat? Furthermore, the step-change in 1996 is likely due to the former 230-litre Stevenson screen being replaced by a 60-litre one during the previous year.
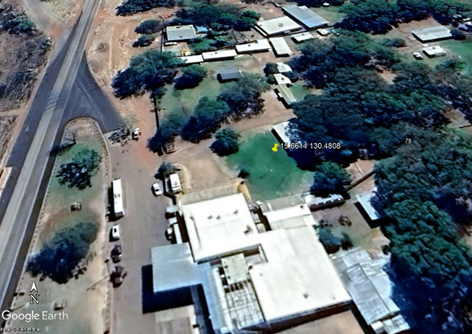
Despite problems with watering and missing observations, Victoria River Downs is one of only several closed or open sites within 200km with reasonable runs of Tmax data (Kununurra town and airport and Kimberley Research Station being others). Although Timber Creek closed in September 2014, it seems from available Google Earth Pro satellite images the site was watered (Figure 3).
Figure 3. The satellite image of the alleged Timber Creek weather station site in August 2022 at Latitude -15.6614o, Longitude 130.4808o. However, the site looks nothing like the site diagram shown in site-summary metadata. There is no sign of the ‘chook shed’, while the ‘house’, appears to be the Timber Creek Travellers Rest Motel and caravan park. Successive images also show the grass surrounding the site is regularly watered. Either the coordinates provided in metadata are incorrect or the diagram is inaccurate.
The problem is that site-summary metadata is faulty.
Close inspection of properties around the town, located the Stevenson screen inside a fenced area that matched the site diagram, at Latitude -15.6600o, Longitude 130.4819o, approximately 190m NE of the location shown in Figure 3.
While regular manual observations may have ceased, the most recent satellite image (August 2023) shows the Stevenson screen is still located within the enclosure. Images from August 2002, show land-use changes, possibly irrigation and the use of herbicide between seasons and years contributed variation that impacted observations, and therefore that lack of site control was the main factor affecting the quality of Tmax data.
Given the paucity of nearby sites, and the lack of useful long-term data, Timber Creek is not such a big overcrowded place that the BoM could not have installed an automatic weather station on vacant land somewhere in the town where site conditions were consistent with the local climate – high monsoonal rainfall from November to March (summer) and low rainfall during the ‘dry’. Unreliable metadata, including routinely failing to document when Stevenson screens are replaced, and lack of site control is a major problem across Australia’s weather station network.
Conclusion
It is concluded that the quality of Tmax data for Timber Creek is exceptionally poor and its use for adjusting faults in ACORN-SAT data at Victoria River Downs, Kalumburu and Rabbit Flat is highly questionable. Data are affected by missing daily data, poor site-control and the probable replacement of a 230-litre Stevenson screen with a 60-litre one around 1996. Although data lack precision, accounting for rainfall and the step change in 1996 left no residual variation attributable to CO2, coalmining, electricity generation or anything else.
Bill Johnston
18 February 2024
Preferred citation:
Johnston, Bill 2024. Is homogenisation of Australian temperature data any good? Part 7b. Timber Creek, Northern Territory, Australia http://www.bomwatch.com.au/ 4 pp.
Disclaimer
Unethical scientific practices including the homogenisation of data to support political narratives undermines trust in science. While the persons mentioned or critiqued may be upstanding citizens, which is not in question, the problem lies with their approach to data, use of poor data or their portrayal of data in their cited and referenceable publications as representing facts that are unsubstantiated, statistically questionable or not true. The debate is therefore a scientific one, not a personal one.
Acknowledgements
David Mason-Jones is gratefully acknowledged for providing invaluable editorial assistance. Research
Bureau of Meteorology ID 014612. Located 430 km SE of Darwin at Latitude -15.5748 Longitude 133.2137. Maximum temperature data from 1 January 1965 to 29 June 2012.
Data quality is poor. The use of faulty data that are not homogeneous, to adjust faults in ACORN-SAT data is unscientific and likely to result in biased outcomes. As the ACORN-SAT project does not ensure comparator datasets are homogeneous, it is deeply flawed and should be abandoned. Read on …
Summary
While data quality is poor, accounting for rainfall and the step-change simultaneously using multiple linear regression left no additional trend or change that could be attributed to the climate, CO2, coalmining or anything else.
1. Background
Situated on the Stuart Highway 430 km southeast of Darwin (Figure 1) maximum temperature (Tmax) observations at Larrimah ceased on 29 June 2012. However, Larrimah Tmax was used by ACORN-SAT (the Australian Climate Observations Reference Network – Surface Air Temperature project) to homogenise Tmax data at Victoria River Downs (1/1/1976 and 1/8/1987, AcV1 and 1/1/2007, AcV2.x) and Burketown airport (1/1/2002, AcV1 and 1/1/1986, AcV2.x).
Figure 1. Larimah Tmax was used to homogenise Tmax data for Victoria River Downs (256km away), and Burketown airport (762 km distant). ACORN-SAT sites are indicated by red buttons, and sites having more than 10-years of data, by grey circles.
This raises the question: is Tmax data for Larrimah any good?
2. Methods
Daily temperature and monthly rainfall were downloaded from the Bureau of Meteorology, Climate Data Online facility (Climate Data Online – Map search (bom.gov.au)). Data were summarised into an annual dataset and analysed using the same BomWatch protocols described previously in the Parafield case study[2] and subsequent reports, including for Victoria River Downs[3] of which this report is a subset.
Only maximum temperature (Tmax) data are used in the study.
3. Results
Ignoring outliers (red squares in Figure 2(a)), rainfall, which is the deterministic portion of the Tmax signal explains 39.5% of Tmax variation (Radj = 0.395). As this is less than the R2adj BomWatch benchmark of 0.50, either data quality is exceedingly poor, or an influential variable has not been accounted for by the naïve Tmax ~ rainfall case (Table 1(i)).
(Note: R2adj calculated by the statistical package R, adjusts variation explained for the number of terms in the linear model, as well as for the number of observations[4]. It is therefore more robust (less biased) than unadjusted R2 calculated by spreadsheet programs such as Excel.)
Rescaled so values are comparable, Tmax ~ rainfall residuals were evaluated for inhomogeneities using STARS, which objectively tests whether the mean of subsequent data is significantly different (P<0.05) to that before, using a t-test of the difference. Indicated by the horizontal line in Figure 2(b), STARS detected an up-step of 0.41oC in 1986 (P = 0.015). Segments defined by the step-change were examined separately in Figure 2(c) and Figure 2(d).
The spread of points about each line, and influence plots (not shown) confirmed that data for 1982 and 2011 were likely outliers. Also, as R2adj was <0.50 data quality was generally poor.
Categorical multiple linear regression of the form Tmax ~ Sh(ift)factor + Rainfall showed rainfall reduces Tmax 0.174oC/100mm, and that segmented regressions were offset by a rainfall adjusted difference of 0.41oC (Figure 2(e)), which is the same as that detected by STARS. Post hoc tests confirmed that data consisted of two non-trending segments interrupted by the step-change in 1986 (Table 1(iv)).
Figure 2. Composite analysis of Larrimah Tmax. A statistical summary for each phase of the analysis is provide in Table 1.
4. Discussion and conclusions
Diagrams in site-summary metadata for 1 September 1964 and 7 December 1968, show the site was originally at the rear of the post office on the western side of the Stuart Highway. However, by 8 June 1992 it had moved to the disused WWII rail terminus of the North Australian Railway, which ceased operations and closed in February 1981.
While the alleged move within the confines of the terminus in November 1998 was not influential, the 1986 step-change was probably due to relocating the site there and replacing the original 230-litre Stevenson screen with a 60-litre one. It seems the move to the trucking-yard, allegedly in 1998, was erroneously reported.
Google Earth Pro satellite images from October 2004 show surrounds of the trucking-yard site were generally bereft of ground cover, which would be sufficient to cause Tmax data to be warmer than at the previous site behind the post office.
Although categorical multiple liner regression confirmed that the up-step in the mean occurred in 1986 (Table 1(iii)), low R2adj and apparent overlap in scatter between the series (Figure 2(e)) show data were of exceptionally poor quality, particularly after 1986. This may have been due to lackadaisical observing practices, including excessive numbers of missing data/year. (Fewer than 340 observations were noted in 1970, 1975 and 1976, and from 1994 to 1998). Although given its role in ACORN-SAT and that the site is isolated, it is surprising that the BoM did not install an automatic weather station at Larrimah. The current site probably closed due to a lack of local interest in making observations and undertaking maintenance.
It was concluded that while data quality is poor, accounting for rainfall and the step-change simultaneously using categorical multiple linear regression, left no additional trend or change that could be attributed to the climate, CO2, coalmining or anything else.
Table 1. Statistical summary. RSS refers to residual sum of squares. Partial R-square (R2partial) estimates the proportion of variation explained by the Sh(ift)factor that is not explained by rainfall alone (calculated as: [(RSSfull – RSSrain)/ RSSfull)*100].
Johnston, Bill 2024. Is homogenisation of Australian temperature data any good? Part 7a. Larrimah, Northern Territory, Australia http://www.bomwatch.com.au/ 3 pp.
Disclaimer
Unethical scientific practices including the homogenisation of data to support political narratives undermines trust in science. While the persons mentioned or critiqued may be upstanding citizens, which is not in question, the problem lies with their approach to data, use of poor data or their portrayal of data in their cited and referenceable publications as representing facts that are unsubstantiated, statistically questionable or not true. The debate is therefore a scientific one, not a personal one.
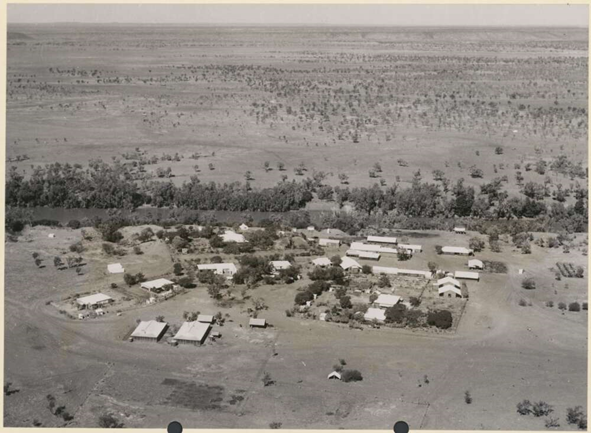
Situated 443 km south of Darwin, 410 km NE of Halls Creek and 433 km north of Rabbit Flat in the Kimberley Region of the Northern Territory, the iconic Victoria River Downs Station was once the largest pastoral holding in the world. The station homestead beside the Ord River (Figure 1), is the location of an Australian Climate Observations Reference Network – Surface Air Temperature dataset (ACORN-SAT) weather station, one of 112 such sites used to monitor climate warming in Australia. Due to the sparseness of the Bureau of Meteorology’s (BoM) network in northern Australia, data for Victoria River Downs (BoM ID 14825) is weighted by ACORN-SAT to be representative of some 3.3% of Australia’s land area.
Figure 1. The Victoria River Downs homestead and outbuildings south of the Ord River in the Kimberley Region of the Northern Territory in 1954 (National Library of Australia, copyright expired: https://nla.gov.au:443/tarkine/nla.obj-137684286).
From when observations commenced in 1965 until about 1979 data were plagued by runs of missing observations, or low data counts per month. Observations were also mostly reported in whole and ½oC from 1975 to 1982. The frequency of whole degrees was higher than other decimal-fractions from when the automatic weather station (AWS) was installed in May 1997 until about 2006. Site-surrounds and the lawn beyond were also irregularly watered. Maximum temperature data (Tmax) could not therefore be judged as high-quality. As data were unavailable from June to September 1973 (N=210), 1973 was omitted from the analysis.
The overall Tmax trend of 0.125oC/decade (P = 0.055) was spuriously due to an abrupt Tmax up-step of 1.12oC in 2013, which was not related to a change in the weather or climate. Accounting for that and the effect of rainfall on observations, left no additional signals that could be attributed to CO2, coalmining, electricity generation or anything else.
The change may have been due to cessation of watering (which was said to have ceased in 2007), replacement of a former 230-litre Stevenson screen with a 60-litre one, or replacement of a wooden 60-litre screen with a plastic one. According to site-summary metadata the Tmax thermometer was removed in July 2012 (thus backup manual observations ceased), but curiously, it was re-installed in March 2016 and replaced again in September 2019. Like many ACORN-SAT sites, metadata (data about the data) is vague and unreliable and not a basis for correcting data for site-change effects.
Consistent with the First Law of Thermodynamics, analysis of trend and change was undertaken using BomWatch protocols that are transparent, objective, and replicable, and cannot be ‘fiddled’ to achieve pre-determined outcomes.
With the First Law onside, nothing can possibly go wrong.
Tmax depends on rainfall such that the drier it is the hotter it gets. If the relationship between Tmax and rainfall is not significant, weak or positive, something is wrong with the data, not the First Law Theorem. Further, if variation explained (R2adj) is less than a benchmark of 0.50 (or 50%) data may either embed a ‘missing variable’ (one that is not explained by the naïve Tmax ~ rainfall case), or the quality of data is arguably too poor for determining trend and change in the climate.
Site related inhomogeneities occur in parallel with observations and are therefore confounded with the Tmax signal. However, as the Tmax ~ rainfall relationship implicitly accounts for the rainfall effect, non-rainfall residuals embed all other sources of variation, including underlying systematic changes related to site-changes. The second step in the Protocol investigates residuals for significant shifts or step-changes in re-scaled residuals indicative of such factors. Importantly, changepoints are detected objectively and cannot be specified in advance.
Identified using a factor variable, final-round analysis verifies that segmented responses to rainfall are the same (slopes are parallel), and that rainfall-adjusted segment means are different (that individual relationships are offset). Each of the three BomWatch protocol steps is transparent, objective and replicable, and supported by subsidiary investigations including analysis of residuals and post hoc tests.
Homogenisation is near the limit of plausibility
The same protocols used to analyse Tmax were used to evaluate homogenisation of the same data by ACORN-SAT.
Three iterations of ACORN-SAT applied adjustments at different times such that past-data were cooled and/or warmed to varying extents toward the present, which is a trick that affects trend. However, while adjustments may stabilise and improve statistical significance (and possibly moderate data quality problems), segmented relationships with rainfall become less clear-cut and less precise overall. Lack of statistical control and the absence of post hoc evaluations is a major weakness of ACORN-SAT.
The political narrative supported by ACORN-SAT will eventually be shown to be false, either as more ACORN-SAT sites are analysed using rigorous BomWatch protocols; or, as time passes and BoM scientists run out of options for making adjustments that seem plausible; or, adjustments cause fundamental Tmax ~ rainfall relationships to break-down. The question then arises: just how many more analyses are needed? or, how many years need to pass, before ACORN-SAT is shown irrevocably to be too unsound, unscientific and unbelievable to continue? As the ACORN-SAT project is unsalvageable, for the sake of those involved it should be abandoned without exception, in its entirety.
Implications
The practical implication is that most messaging related to climate warming in Australia, including the indoctrination of vulnerable schoolchildren and young adults, and State of the Climate reports published by CSIRO, is demonstrably fake. The whole warming agenda has been made-up and carried forward since the call went-out from the World Meteorological Organisation in about 1989 to find and supply data that supported future Intergovernmental Panel on Climate Change (IPCC) reports. Temperature data homogenisation resulted from that.
The scientific implication is that along with models used to predict future climates, scores, possibly thousands of scientific papers and reports that depend on the warming narrative, are worthless.
Studies related to the effect of ‘a warming world’ on health, on agriculture, tourism, urban planning, the Murray-Darling Basin, the Great Barrier Reef, urban water supplies, species extinctions, and for converse reasons, on mining and resource use, are based on a premise that has been fabricated by consensus from the beginning.
The political implication is that the billions of dollars that have been spent on, or are intended to be spent, in order to limit warming to the mythical value of 1.5oC sometime in the future, is entirely wasted. With the national debit spiralling out of control, crippling electricity prices, subsidies and carbon taxes flowing from diminishing numbers of primary producers and workers to the elites, will eventually cripple Australia’s ability to remain sovereign, democratic and free.
As The Science is underpinned by data that has been fabricated to support it, and as the manipulations of past-data will become increasingly implausible going forward, the whole edifice must eventually collapse. Collapse will probably occur within a decade, possibly sooner than 2030.
Finally, as Tmax depends on rainfall, which in Australia is stochastic (unpredictable) and episodic (occurs in episodes), without knowing rainfall in advance, it is impossible to predict the trajectory of Tmax into the future.
Dr Bill Johnston
15 February 2024
Preferred citation:
Johnston, Bill 2024. Is homogenisation of Australian temperature data any good? Part 7. Victoria River Downs, Northern Territory, Australia http://www.bomwatch.com.au/ 15 pp.
Homogenisation of Australian temperature data commenced in the late 1980s and by 1996 under the watchful eye of Bureau of Meteorology (BoM) scientist Neville Nicholls, who at that time was heavily involved with the World Meteorological Organisation (WMO) and the fledgling Intergovernmental Panel on Climate Change (IPCC), the first Australian high-quality homogenised temperature dataset (HQ1) was produced by Simon Torok. This was followed in succession by an updated version in 2004 (HQ2) that finished in 2011, then the Australian Climate Observations Reference Network – Surface Air Temperature (ACORN-SAT) dataset, with version 1 (AcV1) released in 2012 being updated until 2017. AcV2 replaced ACV1 from 2018, with the most recent iteration AcV2.3 updated to December 2021.
Why is homogenisation important?
Data homogenisation represents the pinnacle of policy-driven science, meaning that following release of the First Assessment Report by the Intergovernmental Panel on Climate Change (IPCC) in 1990, for which Neville Nicholls was a substantial contributor, the Australian government set in-place a ‘climate’ agenda. Although initially rejected by Cabinet, in 1989 Labor Senator Graham Richardson proposed a 20% reduction in 1988 Australian greenhouse gas emission levels by 2005. The target was adopted in October 1990 as a bipartisan policy (i.e., by both major Australian political parties) and endorsed by a special premiers conference in Brisbane as the InterGovernmental Agreement on the Environment in February 1992 (https://faolex.fao.org/docs/pdf/aus13006.pdf). Following that meeting in February, the Council of Australian Governments (COAG) was set-up by Labor Prime Minister Paul Keating in December 1992.
Land-surface temperatures had to be shown to be warming year-on-year, particularly since 1950.
Models were needed that predicted climate calamities into the future.
Natural resources -related science, which was previously the prerogative of the States, required reorganisation under a funding model that guided outcomes in the direction of the policy agenda.
Particular attention was also paid to messaging climate alarm regularly and insistently by all levels of government.
As it provides the most tangible evidence of climate warming, trend in maximum temperature (Tmax) is of overarching importance. It is also the weakest link in the chain that binds Australians of every creed and occupation to the tyranny of climate action. If homogenisation of Tmax data is unequivocally shown to be a sham, other elements of the policy, including evidence relied on by the IPCC are on shaky ground. This is the subject of the most recent series of reports published by www.bomwatch.com.au.
The question in this paper is whether trend and changes in the combined Tmax dataset for Halls Creek, reflect site and instrument changes or changes in weather and climate.
Halls Creek maximum temperature data
Detailed analyses of Halls Creek Tmax using objective, replicable physically-based BomWatch protocols found data were affected by a change at the old post office in 1917, another in 1952 after the site moved to the Aeradio office at the airport in 1950, and another in 2013 due to houses being built within 30m of the Stevenson screen two years before it relocated about 500m southeast to its present position in September 2015. Three step-changes resulted in four data segments; however, mean Tmax for the first and third segments were not different.
While the quality of data observed at the old post office was inferior to that of sites at the airport, taking site changes and rainfall into account simultaneously left no trend or change in Tmax data that could be attributed to climate change, CO2, coal mining, electricity generation or anything else. Furthermore, step-changes in the ratio of counts of data less than the 5th and greater than the 95th day-of-year dataset percentiles (low and high extremes respectively) were attributable to site changes and not the climate. Nothing in the data therefore suggests the climate of the region typified by Halls Creek Tmax has warmed or changed.
Homogenisation of Halls Creek data
As it was originally conceived, homogenisation aimed to remove the effects non-climate impacts on data, chief amongst those being weather station relocations and instrument changes, so homogenised data reflected trends and changes in the climate alone. In addition, ACORN-SAT sought to align extremes of data distributions so, in the words of Blair Trewin, data “would be more homogeneous for extremes as well as for means”. To achieve this, Trewin used first-differenced correlated reference series and complex methods to skew data distributions at identified changepoints based on transfer functions. This was found to result in an unrealistic exponential increase in upper-range extremes since 1985.
Reanalysis using BomWatch protocols and post hoc tests and scatterplots showed that in order to achieve statistically significant trends, homogenisation cooled past temperatures unrealistically and too aggressively. For instance, cool-bias increased as observed Tmax increased. It was also found that the First Law of Thermodynamics on which BomWatch protocols are based, did not apply to homogenised Tmax data. This shows that the Bureau’s homogenisation methods produce trends in homogenised Tmax data that are unrelated to the weather, and therefore cannot reflect the climate.
As it was consensus-driven and designed to serve the political ends of WWF and Australia’s climate industrial elites, and it has no statistical, scientific or climatological merit, the ACORN-SAT project is a disgrace and should be abandoned in its entirety.
[1] Former NSW Department of Natural Resources research scientist and weather observer.
Two important links – find out more
First Link: The page you have just read is the basic cover story for the full paper. If you are stimulated to find out more, please link through to the full paper – a scientific Report in downloadable pdf format. This Report contains far more detail including photographs, diagrams, graphs and data and will make compelling reading for those truly interested in the issue.
Second Link: This link will take you to a downloadable Excel spreadsheet containing a vast number of supporting data points for the Potshot (Learmonth) paper.
Careful analysis using BomWatch protocols showed that ACORN-SAT failed in their aim to “produce a dataset which is more homogeneous for extremes as well as for means”. Their failure to adjust the data for a step-change in 2002 shows unequivocally that methodology developed by Blair Trewin lacks rigour, is unscientific and should be abandoned.
Read on …
Potshot was a top-secret long-shot – a WWII collaboration between the United States Navy, the Royal Australian Air Force and Australian Army, that aimed to deter invasion along the lightly defended north-west coast of Western Australia and take the fight to the home islands of Japan. It was also the staging point for the 27- to 33-hour Double-Sunrise Catalina flying-boat service to Ceylon (now Sri Lanka) that was vital for maintaining contact with London during the dark years of WWII. It was also the base for Operation Jaywick, the daring commando raid on Singapore Harbour by Z-Force commandos in September 1943.
The key element of Potshot was the stationing of USS Pelias in the Exmouth Gulf to provide sustainment to US submarines operating in waters to the north and west. To provide protection, the RAAF established No. 76 OBU (Operational Base Unit) at Potshot in 1943/44 and, at the conclusion of hostilities, OBU Potshot was developed as RAAF Base Learmonth, a ‘bare-base’ that can be activated as needed on short-notice. Meteorological observations commenced at the met-office in 1975. Learmonth is one of the 112 ACORN-SAT sites (Australian Climate Observations Reference Network – Surface Air Temperature) used to monitor Australia’s warming. Importantly, it is one of only three sites in the ACORN-SAT network where data has not been homogenised.
Potshot was the top-secret WWII base that transitioned to RAAF Base Learmonth at the conclusion of WWII.
By not adjusting for the highly significant maximum temperature (Tmax) step-change in 2002 detected by BomWatch, ACORN-SAT failed its primary objective which is to “produce a dataset which is more homogeneous for extremes as well as for means”.
Either Blair Trewin assumed the 12-year overlap would be sufficient to hide the effect of transitioning from the former 230-litre Stevenson screen to the current 60-litre one; or his statistical methods that relied on reference series were incapable of objectively detecting and adjusting changes in the data.
In either case it is another body-blow to Trewin’s homogenisation approach. Conflating the up-step in Tmax caused by the automatic weather station and 60-litre screen with “the climate” and lack of validation within the ACORN-SAT project generally, unethically undermines the science on which global warming depends.
Due to their much-reduced size, and lack of internal buffering, 60-litre Stevenson screens are especially sensitive to warm eddies that arise from surfaces, buildings etc. that are not representative of the airmass being monitored.
Increased numbers of daily observations/year ≥95th day-of-year dataset percentiles relative to those ≤5th day-of-year percentiles, which explains the up-step, is a measurement issue, not a climatological one.
By omission in the case of Learmonth, as ACORN-SAT produces trends and changes in homogenised data that do not reflect the climate, the project and its peers including others run under the guise of the World Meteorological Organisation of which Trewin is a major player, should be abandoned.
Dr. Bill Johnston
12 January 2023
Two important links – find out more
First Link: The page you have just read is the basic cover story for the full paper. If you are stimulated to find out more, please link through to the full paper – a scientific Report in downloadable pdf format. This Report contains far more detail including photographs, diagrams, graphs and data and will make compelling reading for those truly interested in the issue.
Dr Trewin and his peers, including those who verify models using ACORN-SAT data, scientists at the University of NSW including Sarah Perkins-Kilpatrick, those who subscribe to The Conversation or The Climate Council are welcome to fact-check or debate the outcome of our research in the open by commenting at www.bomwatch.com.au. The Datapack relating to the Potshot Report is available here Learmonth_DataPack
The ACORN-SAT project is deeply flawed, unscientific and should be abandoned.
Read on …
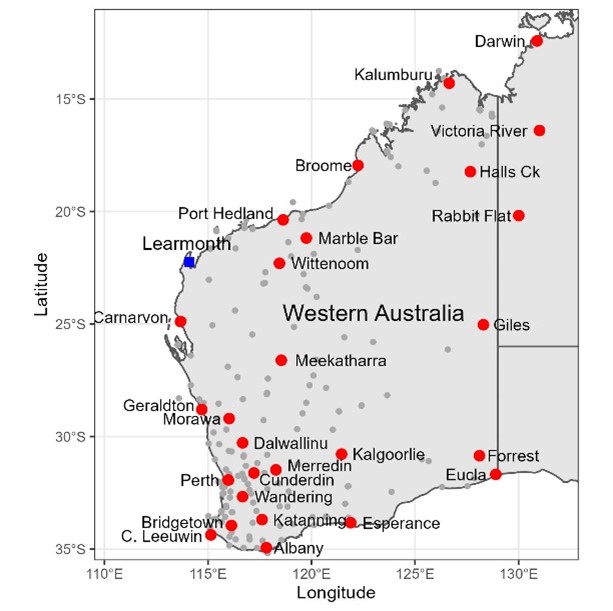
Maximum temperature data for Carnarvon, Western Australia is surprisingly no use at all for tracking climatic trend and change. With Learmonth close second at Longitude 114.0967o, Carnarvon (113.6700o) is the western-most of the 112 stations that comprise the ACORN-SAT network (Australian Climate Observations Reference Network – Surface Air Temperature) used to monitor Australia’s warming (Figure 1). Carnarvon is also just 1.4o Latitude south of the Tropic of Capricorn but unlike Learmonth, which receives moderate rain in February, Carnarvon receives practically none from the end of August through to March. Due to its vast underground aquifer, the lower Gascoyne is the most productive irrigation area in WA and most of the vegetables, melons and fruits sold in Perth are grown around Carnarvon.
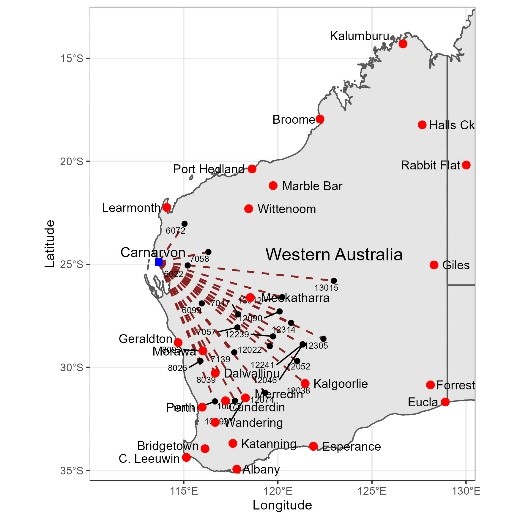
Figure 1. The distribution of ACORN-SAT sites in WA, as well as all the neighbouring sites used by ACORN-SAT v.3 to homogenise Carnarvon data.
Located about 900 km north of Perth, Carnarvon post office, built in 1882, was an important link in the expanding WA telegraph network and the aerodrome was an important refuelling stop. Runways were lengthened by the Royal Australian Air Force and during WWII it was used as a forward operation base
Servicing the main 1930s west-coast air corridor from Perth to Darwin, and Java and on to Europe, Aeradio was established by the Air Board in Geraldton, Carnarvon, Port Hedland, and at aerodromes every 300 km or so further north, and around Australia in 1939/40. A close-up view of Carnarvon Aeradio snipped from a 1947 aerial photograph is shown in Figure 2. While weather observers trained by the Bureau of Meteorology (BoM) in Melbourne undertook regular weather observations, prepared forecasts and provided pilot briefings, radio operators maintained contact with aircraft and advised of inclement conditions. As units were well-distributed across the continent, combined with post officers that reported weather observations by telegraph, the aeradio network formed the backbone of ACORN-SAT. Homogenisation of their data with that of post offices, lighthouses and pilot stations ultimately determines the apparent rate of warming in Australia’s climate.
Figure 2. A snip of the Carnarvon aerodrome operations precinct in 1949 showing location of facilities and that are area in the vicinity of the met-enclosure (met) was watered. (Three additional radio masts were located within in the watered area and watering was probably necessary to ensure grounding of the earth-mat buried in the dry soil.)
Despite several rounds of peer review the question of whether trends and changes in raw data are homogenised Tmax data reflect site and changes or the true climate has not been independently assessed.
The research is important. Alteration of data under the guise of data homogenisation, flows through to BoM’s annual climate statements, CSIRO’s State of the Environment, and State of the Climate reports, reports put out by IPCC, COP, and the World Economic Forum, and ultimately government supported scare campaigns run by WWF, the Climate Council and other green groups, that underpin the unattainable goal of net-zero.
Commencing around 1990, Australia’s homogenisation campaign has been overseen by Dr Neville Nicholls, Emeritus Professor at Monash University, a loud and vocal supporter of the warming hypotheses. Changing the data on which it is based, then claiming in collegially peer-reviewed publications that the climate is warming, risks considerable economic, strategic and political harm. Australia is being weakened from within by Nicholls and his protégés, including those within CSIRO, and every aspect of the economy, from de-industrialisation, to attacks on agriculture, to looming conflict with China is predicated by temperature data homogenisation.
Summary findings
Good site control is fundamental to any experiment investigating long-term trend and change. However, the site at the post office was shaded, watered and generally poor, the Aeradio site was also watered, while the site at the meteorological office was subject to multiple changes after 1990.
Homogenisation failed to undertake basic quality assurance and frequency analysis, so could not objectively adjust for the effect of extraneous factors such as watering, site chances etc. Consequently, as ACORN-SAT data for Carnarvon were not homogeneous either for extremes or annual means it failed its primary objective.
While changing data to agree with hypotheses is unscientific and dishonest, the most obvious homogenisation subterfuge is the adjustment of changes that made no difference to the data, while ignoring those that did. Second, using reference series comprised of neighbouring datasets without ensuring they are homogeneous.
The use of correlated data that likely embed parallel faults to disproportionally correct faults in ACORN-SAT data and thereby embed trends in homogenised data, has no statistical or scientific merit. As the ACORN-SAT project is misleading irredeemably deeply flawed and is a clear danger to Australia’s prosperity and security, it should be abandoned.
A reoriented and rescaled overlay of an aerial photograph showing the watered airport precinct relative to the location of the post office in 1947, and the November 2021 Google Earth Pro satellite image, locating the same sites. Runways were unsealed in 1947 and there were still several splinter-proof aircraft shelters visible (marked ‘s’). By 2021 they had moved the non-directional beacon (NDB) from behind the power house (ph), and the site to the right of the meteorological office (MO) had been moved out of the way of the access road. The MO closed in 2016.
3 January 2023
Two important links – find out more
First Link: The page you have just read is the basic cover story for the full paper. If you are stimulated to find out more, please link through to the full paper – a scientific Report in downloadable pdf format. This Report contains far more detail including photographs, diagrams, graphs and data and will make compelling reading for those truly interested in the issue.
Note: Line numbers are provided in the linked Report for the convenience of fact checkers and others wishing to provide comment. If these comments are of a highly technical nature, relating to precise Bomwatch protocols and statistical procedures, it is requested that you email Dr Bill Johnston directly at scientist@bomwatch.com.au referring to the line number relevant to your comment.
[1] Former NSW Department of Natural Resources research scientist and weather observer.
The ACORN-SAT project is deeply flawed, unscientific and should be abandoned.
Read on …
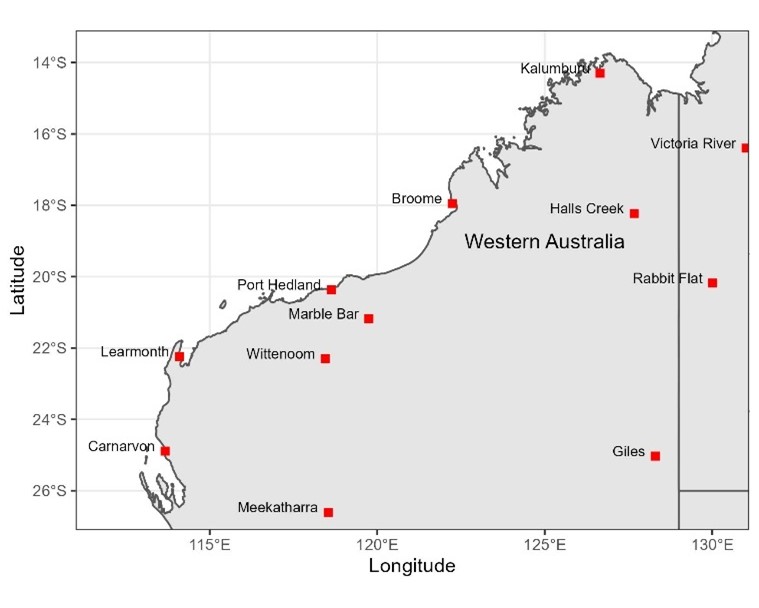
Situated 500 km east from Shark Bay, south of the Gibson Desert and adjacent to the Great Victoria Desert, Meekatharra is a hot, dry isolated outback town in mid-west Western Australia. Famously referred to as the end of the earth by Australia’s former Prime Minister, Malcolm Fraser when his aircraft was diverted from Perth in 1977 due to inclement weather, Meekatharra is now the epicentre of a mining boom and the airport serves as a hub for fly-in fly-out workers and a base for the Royal Flying Doctor Service (RFDS).
Constructed as an all-weather ‘bare-base’ aerodrome with long, sealed runways in 1943, linking Perth, the secret bomber base at Corunna Downs near Marble Bar, and Darwin, Meekatharra was one of only a few aerodromes in outback WA capable of handling heavy bombers. It was relinquished by the RAAF to the Department of Civil Aviation as a Commonwealth airport after 1946, and ownership transferred to the Shire of Meekatharra in 1993.
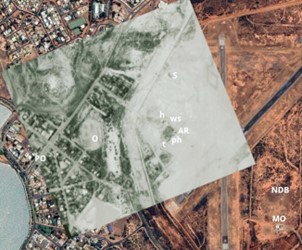
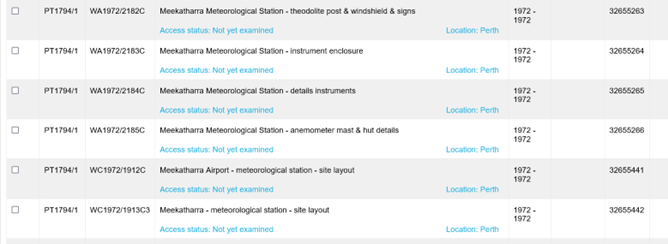
Weather observations commenced at the post office on the corner of Main and High streets Meekatharra in January 1926, having previously been reported from Peak Hill, about 110 km to the NW from 1898. Observations transferred to the former RAAF Aeradio office in 1950, and according to ACORN-SAT metadata, the site moved to a new meteorological office (MO) in about 1975 (Figure 1). However, files held by the National Archives of Australia (NAA) show that before the office was built in 1974, an instrument enclosure, instruments, a theodolite post and wind shield used in launching weather balloons were installed near the proposed new office in 1972 (Figure 2). The overlap with data from the previous Aeradio site, which continued to be used at least until staff relocated, probably in 1975 (Figure 3), was apparently used to smooth the transition to the new site.
ACORN-SAT
Meekatharra is one of 112 Australian Climate Observations Reference Network – Surface Air Temperature (ACORN-SAT) sites used by the Bureau of Meteorology, CSIRO, state governments, WWF and the Climate Council, to convince themselves, kiddies for climate action, and everyone else that the climate is warming irrevocably due to CO2.
Combined with dodgy measurement practices, data homogenisation is used at Meekatharra to create warming in maximum temperature (Tmax) data that is unrelated to the climate. Adjusting for a change in 1934 that was not significant, ignoring that the Aeradio site was watered, and that a period of overlap from 1972 was used to smooth the move to the MO site, allegedly in about 1975, for which no adjustment was made, created trends in homogenised data that were unrelated to the climate. Furthermore, data for the total of 18 sites used to homogenise Meekatharra Tmax, were not homogeneous.
The assertion that ACORN-SAT sites have been carefully and thoroughly researched, and that comparator reference sites selected on the basis of inter-site correlations would be broadly homogeneous around the time site changes occurred is demonstrably untrue. From multiple perspectives, the underlying proposition that series derived from up to 10 reference stations could provide a “high level of robustness against undetected inhomogeneities” is not supported.
As no change in the climate is detectable across the nineteen datasets examined, including Meekatharra, and the methodology is unscientific and deeply flawed, the ACORN-SAT project should be abandoned.
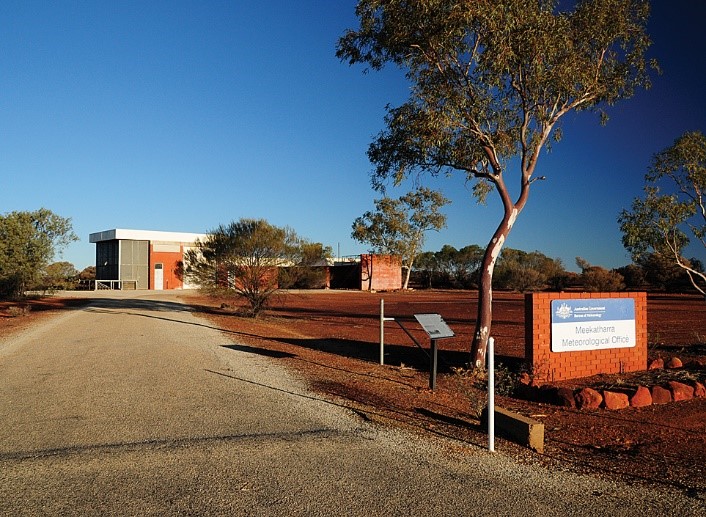
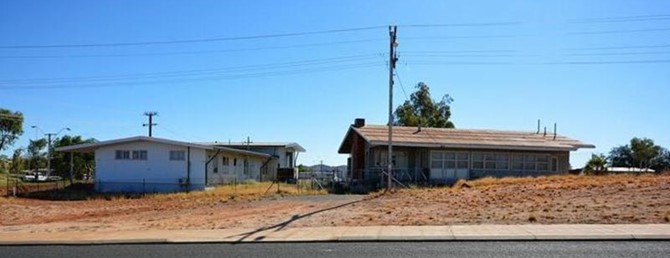
Figure 1. The Meekatharra meteorological office in August 2010 (from the ACORN-SAT Catalogue).
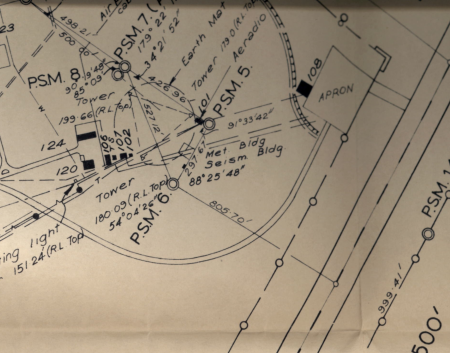
Figure 2. A screenshot of files held by the National Archives of Australia relating to the new 1972 instrument enclosure at Meekatharra (Search term Meekatharra meteorological).
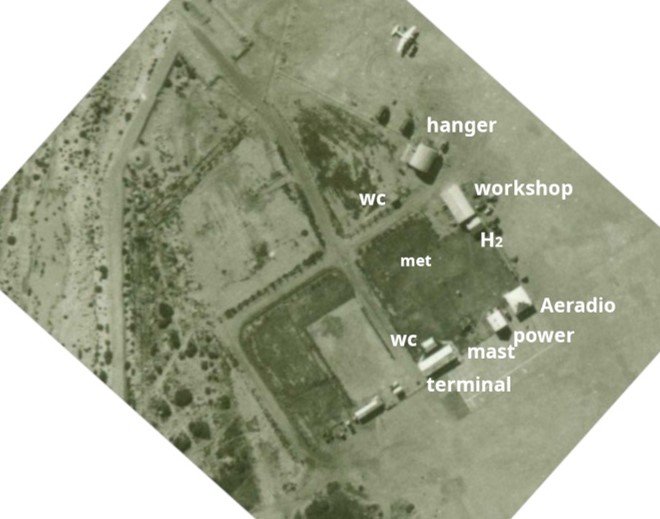
Figure 3. Building plan in 1971 showing the RFDS hanger (108), Aeradio and met-office (101), the fenced enclosure southwest of the office including met (H2) and seismograph huts, towers suspending the aerial array and earth-mat, workshop (102), fuel bowser (107), power plant (106), and workshop and equipment buildings (120 and 124).
An important link – find out more
The page you have just read is the basic cover story for the full paper. If you are stimulated to find out more, please link through to the full paper – a scientific Report in downloadable pdf format. This Report contains far more detail including photographs, diagrams, graphs and data and will make compelling reading for those truly interested in the issue.
Note: Line numbers are provided in the linked Report for the convenience of fact checkers and others wishing to provide comment. If these comments are of a highly technical nature, relating to precise Bomwatch protocols and statistical procedures, it is requested that you email Dr Bill Johnston directly at scientist@bomwatch.com.au referring to the line number relevant to your comment.
[1] Former NSW Department of Natural Resources research scientist and weather observer.
Maximum temperature data for Marble Bar exemplifies all that is wrong with the Australian Climate Observations Reference Network – Surface Air Temperature (ACORN-SAT) dataset used to depict Australia’s warming. Subjective adjustments based on faulty metadata and highly correlated comparator sites that likely embed parallel faults results in trends in homogenised data that are unrelated to the climate.
Read on …
Background
Located 150 km southeast of Port Hedland on the edge of the Great Sandy Desert, Marble Bar is reputed to be the warmest place in Australia. The dry season from April to November is extremely dry, while during the ‘wet’, potential evaporation exceeds rainfall even in the wettest month of February. Nevertheless, irregular cyclonic intrusions from the Timor Sea and eastern Indian Ocean can wreak havoc across the Pilbara including at Marble Bar.
Temperature and rainfall have been measured at several locations under a variety of conditions by post office staff and volunteers since 1901. However, due to its isolation the weather station was rarely inspected by the Bureau of Meteorology (BoM), consequently metadata (data about the data) is unreliable. What was it like ‘doing the met’ under blistering hot conditions and how did equipment including thermometers fare with furnace-like winds, desert dust, and at the other extreme, cold winter nights? Typical of an arid swath of northwestern Australia, Marble Bar is an Australian Climate Observations Reference Network – Surface Air Temperature (ACORN-SAT) dataset used to calculate Australia’s warming (Figure 1).
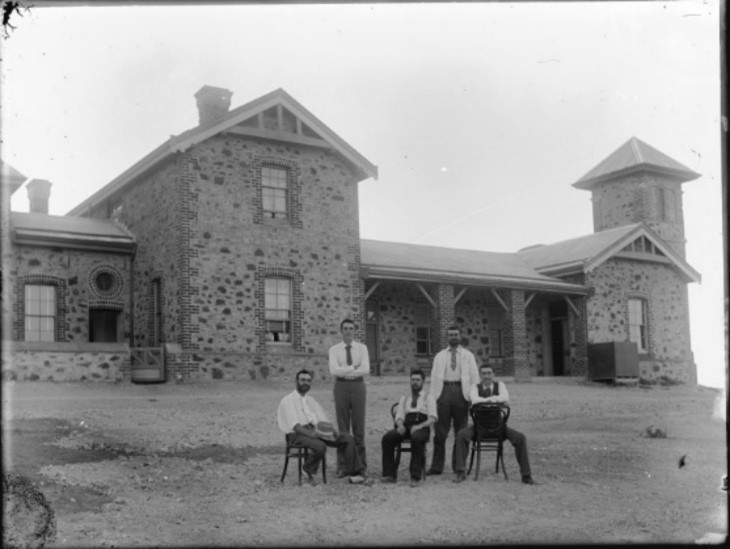
Figure 1. Marble Bar in relation to other ACORN-SAT sites in northwestern Australia (left), and below, staff outside the original post office in 1900, which was built of local stone (State Library WA).
ACORN-SAT metadata failed to mention that a Stevenson screen was originally supplied in 1911 and that the site moved to the new post office on the corner of Francis and Contest streets in 1948 (Figure 2). Also, that the post office was extended in 1961 to accommodate the telephone line exchange which probably required the Stevenson screen to move up-hill towards the shady watered yard behind the residence. It seems the post office closed in 1984 and its functions including weather observations transferred to the general store opposite the Ironclad Hotel (now licenced post office) 230m east. Later, in 1988 the site allegedly moved east, probably to the Roadhouse, from where it relocated to its current position 100m southwest in 1997.
Figure 2. The side-view of the 1948 post office facing Francis Street (left) photographed in 2016 with the 1961 telephone line exchange annex distant from the camera, and the former residence facing Contest Street (realestate.com.au online sales brochure). Original plans show a path between the residence and the rear of the post office and several out-buildings behind including fuel store, generator/battery shed, and garage.
Objective detection of changes in data using robust statistical methods and post hoc attribution is more reliable than using ACORN-SAT and site summary metadata which is often inaccurate and incomplete. Although now restored, by 1945 the original government offices incorporating the post office had been damaged by cyclones and was riddled with termites. Planned for in 1944, the new post office shown in Figure 2 was not opened until August 1948.
A down-step in Tmax data in 1945, which ACORN-SAT interpreted as site move appeared to be due to observers consistently rounding observations down to the nearest wholeoF, which after converting to Celsius effectively reduced average rainfall-adjusted Tmax by about 0.5oC. While rounding ceased in 1960, data remained cooler than previously until 1988, when it was said the site had become overgrown and was moved “1 km to a residence”. Within that time the Stevenson screen moved clear of the 1961 telephone line exchange, which affected the frequency of high vs low extremes; observations were metricated from 1 September 1972, which affected precision; and in 1984 the site moved to the general store (the current licenced post office), where whole and ½oC were over-reported from 1995 to 1997. It was only after the site relocated in 1998 that data were reasonably consistently observed to the nearest decimal place.
Lack of precision (low R2adj) in the relationship between Tmax, rainfall and site changes, indicates the quality of Marble Bar data is relatively poor. While site changes caused Tmax data to warm 0.9oC since 1901, no warming is attributable to the climate.
Homogenisation
The Bureau’s homogenisation methods are plagued by faulty metadata and the biased selection of neighbouring sites used to make adjustments.
Read on …
The most obvious problems with the Bureau’s temperature homogenisation methods are:
Metadata for weather stations including Marble Bar is either misleading, scant or non-existent.
As no weather stations have stayed the same, it is highly likely within regions that many had undergone concurrent changes/upgrades since they were first established. Examples include post-WWII changes at aerodromes in the late 1940s, installing telephone line exchanges at post offices in the 1950s, metrication in 1972, installation of the major trunk network microwave towers in post office yards by Telecom by 1975, the staged introduction of 60-litre Stevenson screens, automatic weather stations etc.
As many weather stations are affected by synchronous changes and all exhibit similar seasonal cycles, selection of comparator datasets from the pool of possible contenders on the basis of linear correlation of first differences is bound to rank those having parallel faults as candidates for making ACORN-SAT adjustments.
Using faulty metadata to subjectively determine times when something changed, allows changepoints to be manipulated to achieve pre-determined trends. It also discourages further investigation of their cause. For instance, the 1944/1945 down-step at Marble Bar was due to a precision problem not a site move. Other changes included that from 1966 to 1985 the frequency of daily observations greater than 95th day-of-year percentiles was significantly depressed, probably due to watering or shade. Reconstructing what actually happened based on effects observed in data requires changepoints to be identified statistically using robust, statistical methods and post hoc investigation of causes.
Using Pearsons linear correlation to select up to 40 neighbouring sites for constructing comparative reference series is biased. As monthly averages cool from summer to winter and warm from winter to summer, residual cycles in first-differenced data inflate significances of correlations. Thus, from the pool of potential neighbours whose data are not homogeneous, linear correlation is likely to select those having parallel faults. Furthermore, increasing the number of comparators cannot overcome the high likelihood that station changes within regions are somewhat synchronised.
Objective, replicable homogenisation would investigate time-related changes in properties of datasets using objective statistical tests (of which there are a number) and relate changes in the data to what is known about the site post hoc. For example, by comparing detected changepoints with BoM metadata, documents, maps, plans and aerial photographs held by the National Archives and the National Library of Australia, state authorities, museums, historical societies, newspaper reports etc. Even if supporting information is not available, statistical detection based on the probability of an abrupt sustained change against the NULL hypothesis of no change should be sufficient evidence that change occurred.
Historic data were not collected to be used decades in the future to detect trend and change. Due to inaccurate metadata, poor site control (screen and instrument deterioration, watering, shade), and prior to metrication on 1 September 1972, lack of precision by observers, Marble Bar data could not be regarded as high-quality. As the Bureau’s homogenisation methods are deeply flawed the ACORN-SAT project should be abandoned.
Two important links – find out more
First Link: The page you have just read is the basic cover story for the full paper. If you are stimulated to find out more, please link through to the full paper – a scientific Report in downloadable pdf format. This Report contains far more detail including photographs, diagrams, graphs and data and will make compelling reading for those truly interested in the issue.
Second Link: This link will take you to a downloadable Excel spreadsheet containing a vast number of Marble Bar data points for the years from 1901 to 2020 and which was used in the analysis of the Marble Bar weather records to support the Full Report.
Note: Line numbers are provided in the linked Report for the convenience of fact checkers and others wishing to provide comment. If these comments are of a highly technical nature, relating to precise Bomwatch protocols and statistical procedures, it is requested that you email Dr Bill Johnston directly at scientist@bomwatch.com.au referring to the line number relevant to your comment.
[1] Former NSW Department of Natural Resources research scientist and weather observer.
Part 1. Methods case study: Parafield, South Australia
Dr Bill Johnston
scientist@bomwatch.com.au
Imagine arriving at a crime scene with a toolkit of technical knowhow, where the only evidence of what happened is some maximum temperature data and incomplete notes about where they were observed and conditions that may have affected them.
Time starts NOW …..
Background
Methods used by Bureau of Meteorology (BoM) senior research scientist Dr Blair Trewin, lead author of Working Group I of the IPCC’s 2021 Sixth Assessment report, and a member of the World Meteorological Organisation Expert Team on Climate Monitoring and Assessment, and before him Neville Nicholls, Simon Torok, Paul Della-Marta (and others) and Karl Braganza, are in urgent need of review.
All have published papers in peer-reviewed scientific journals relating to data homogenisation and based on those papers, which are in the public domain, claims have been made repeatedly by The Conversation, the ABC, The Guardian and Fairfax media and even The Australian, and for Braganza, to the 2019/20 Bushfires Royal Commission, that temperature measured at BoM weather stations has increased in recent decades due to anthropogenic emissions of CO2.
Maximum temperature (Tmax) varies up and down depending on how much net energy is convected away as latent heat via evaporation from plants, soil and surfaces (collectively referred to as evapotranspiration). As evapotranspiration at dryland sites cannot exceed the rainfall, latent heat loss equals 2.26 MJ/kg of water evaporated, equivalent to is 2.26 MJ/mm of rainfall received.
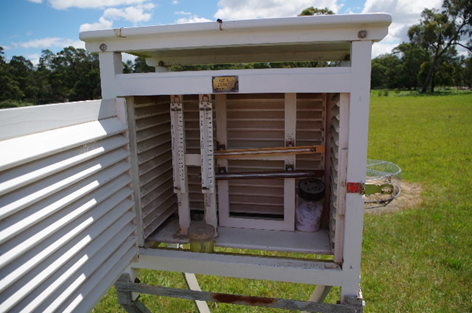
Evapotranspiration of average rainfall at Parafield (443 mm) for example, would remove 1001.2 MJ of energy (443mm times 2.26 MJ), which is 15.7% of average total solar exposure of 6345 MJ/yr. The balance, not accounted for by evapotranspiration heats the air in contact with the ground, and it is that portion of the local heat balance that is measured during the heat of the day by Tmax thermometers held 1.2m above the ground in Stevenson screens (Figure 1). It follows that for any weather station, dry years are warm and the drier it is the warmer it gets.
Figure 1. Maximum and minimum thermometers held horizontally; and dry and wet-bulb thermometers held vertically in the well-maintained 60-litre Stevenson screen at Cranbourne Botanic Gardens, Melbourne.
The First Law Theorem, that available energy is expended via latent and sensible heat pathways, provides a physical reference frame for evaluating the quality of weather station data based on the relationship between Tmax and rainfall, which should be linear and negative. The proportion variation explained by rainfall, known as the coefficient of determination (R2 or more exactly R2 adjusted for the number of terms in the model (R2adj)) provides a measure of the quality of Tmax data (Figure 2). Watering, deterioration of equipment and lackadaisical practices reduce the goodness of fit (R2adj <0.05 or 50% of variation explained), while for an excellent site it may be as high or higher than 0.7 (>70%).
The first tool in the toolbox, naïve linear regression of the form average Tmax ~ annual rainfall, investigates the fitness of Tmax data using rainfall as the comparator or control variable. The coefficient (Tmax/100mm of rainfall), its sign (+ or ‑), significance (P level) and variation explained (R2adj) assist diagnosis of the dataset.
Read on …
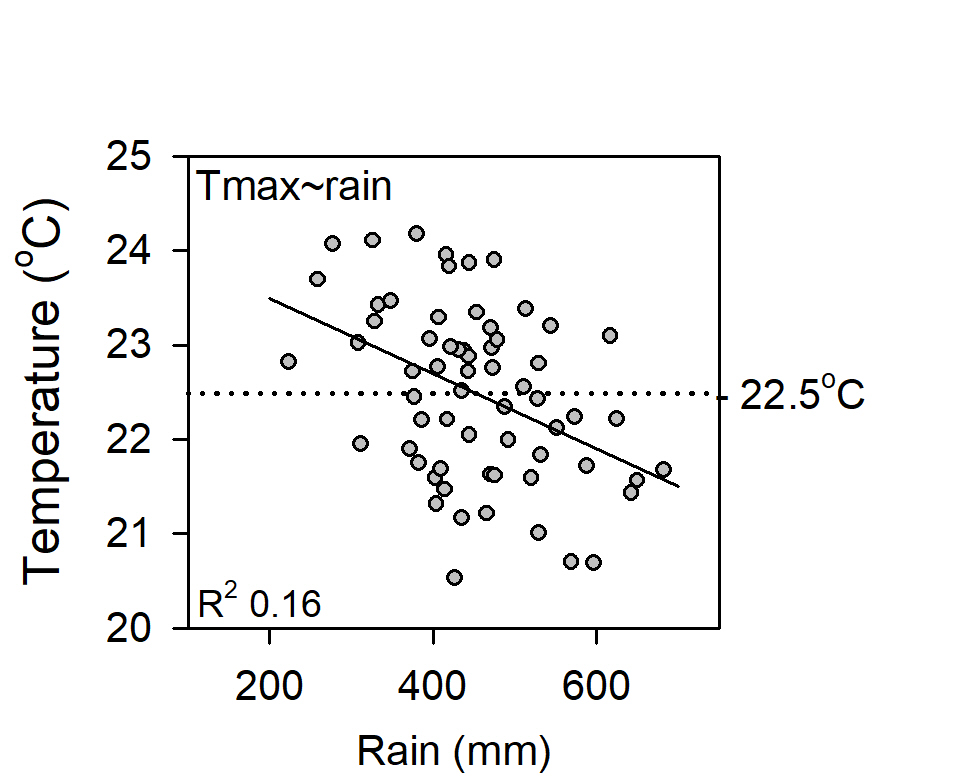
Figure 2. The naïve relationship between average Tmax and annual rainfall at Parafield. Although the slope is negative and highly significant (P <0.001), only 16% (R2adj = 0.16) of variation is explained.
The line in Figure 2 only explains the rainfall portion of the Tmax signal and so while rainfall reduces Tmax ‑0.04oC/100mm and the coefficient is highly significant (the P level is less than 0.001), only 16% of variation is explained, thus, the relationship is very imprecise. So, what of the unexplained variation – the residual non-rainfall portion of the signal?
Calculated as the difference between the line (the equation), and each Tmax data-point, most statistical packages provide a table of residuals, which may be positive or negative. However, programs like Excel require them to be calculated manually (there are examples on the internet).
Independent statistical methods are used to examines Tmax ~ rainfall residuals – that part of the signal not related to rainfall, which if all variation is explained, should be random and free of systematic effects.
Read on …
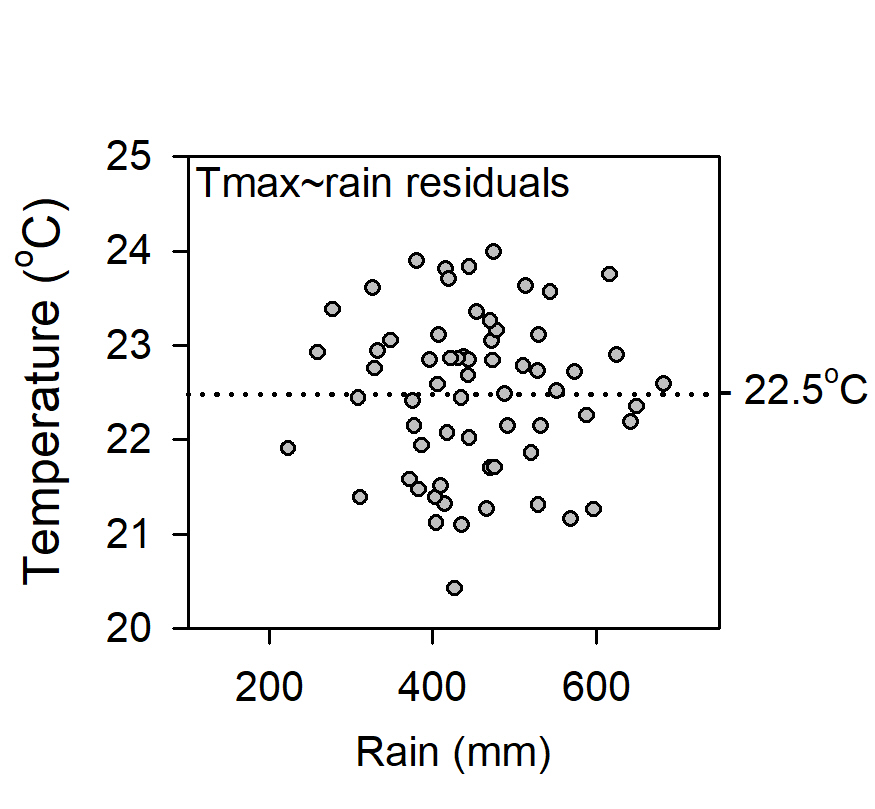
Residuals from naïve regression are usually small, zero-centred numbers. Adding the dataset grand-mean to each value reconstitutes the original scale without changing their relativity or other properties. Except that the points in Figure 3 appear random, the Figure provides little additional information. However, while the data seem sound, low precision suggests a variable may be missing.
Figure 3. Rescaled residuals from the Tmax ~ rainfall relationship in Figure 2.
Linear regression partitions the original dataset into the portion of the Tmax signal attributable to rainfall, which is the physically deterministic covariable described by the linear fit in Figure 2, and variation that is independent of rainfall, which are the re-scaled residuals in Figure 3.
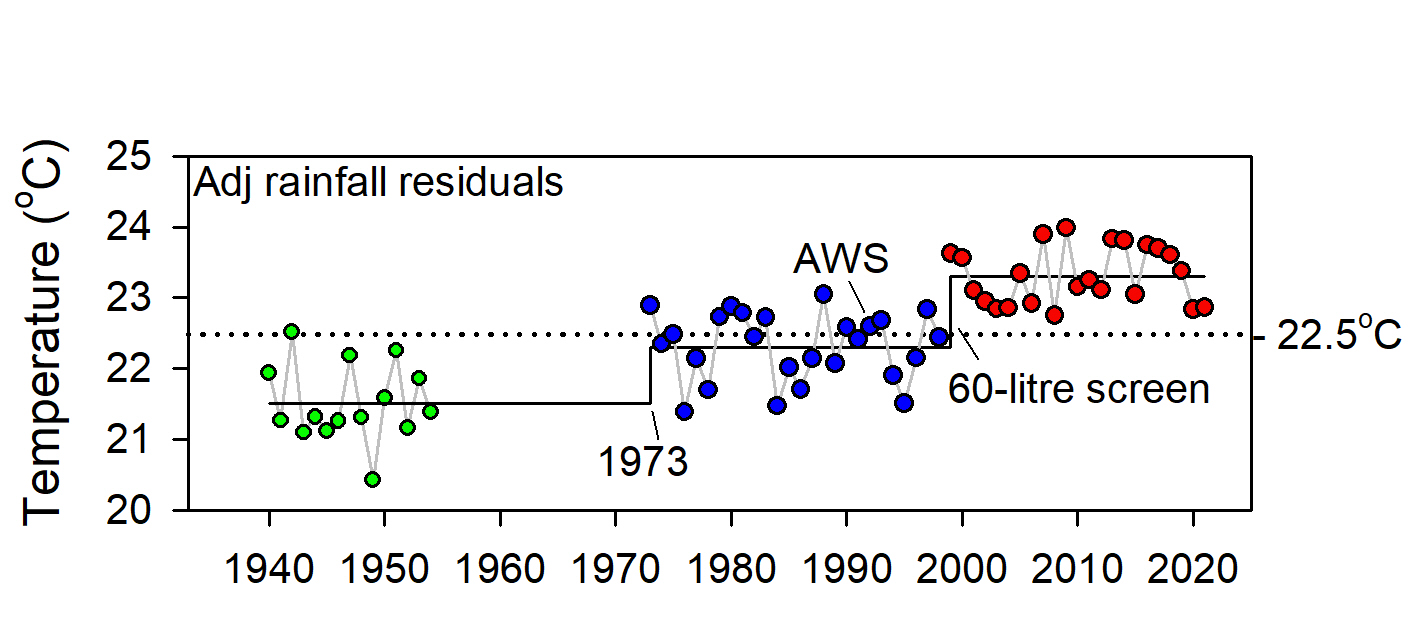
Next, the rescaled residuals in Figure 3 are analysed in the order they were observed and checked for changes that may indicate background, non-rainfall effects (Figure 4).
Figure 4. Step-change analysis of re-scaled residuals identified step-changes in 1973 which was caused by a site move before 1968, and another in 1999, probably caused by replacing a former 230-litre Stevenson screen with a more sensitive 60-litre one. (Data from 1955 to 1973 exist, but have not been digitised)
Step-changes Tmax residuals in Figure 4 were highly significant, meaning there was a very low probability they were due to chance. Analysis was undertaken using the Excel 2007 version of Sergi Rodionov’s Sequential Three-step Analysis of Regime Shifts (STARS) v6.3 (ICES Journal of Marine Science, 62: 328e332 (2005) doi:10.1016/j.icesjms.2005.01.013), which is in the public domain (https://sites.google.com/view/regime-shift-test/downloads). While other step-change tools are available (see https:// www.marinedatascience.co/blog/2019/09/28/comparison-of-change-point-detection-methods/), STARS is convenient, reliable and comparable with other methods.
Closing the case. Metadata, archived aerial photographs maps, plans, satellite images etc. are used where possible to confirm step-change scenarios and to find the combination that best fits the data. There is only one optimal outcome, which is that segmented responses to rainfall are the same (segmented regressions are parallel) and that rainfall-adjusted group means are different (segmented regressions are not coincident). While the data stepped up, no evidence was found that the climate had changed or warmed.
The BomWatch approach is objective, robust and replicable and does not involve data manipulation. It is also amenable to batch-processing of paired Tmax-rainfall datasets in the Bureau of Meteorology’s database, which would put to rest the hype about climate change and warming once-and-for-all.
Read on …
Bias in the BoM’s homogenisation methods
Comparative homogenisation methods used by the Bureau are highly questionable. Problems include:
Use of faulty and unreliable metadata for specifying/verifying changepoints in target site data (data to be homogenised);
First-differenced linear correlation with the target-site data, selects comparators that likely embed parallel faults;
Overly complicated methods lack transparent checks and balances that provide confidence that their methods are trustworthy.
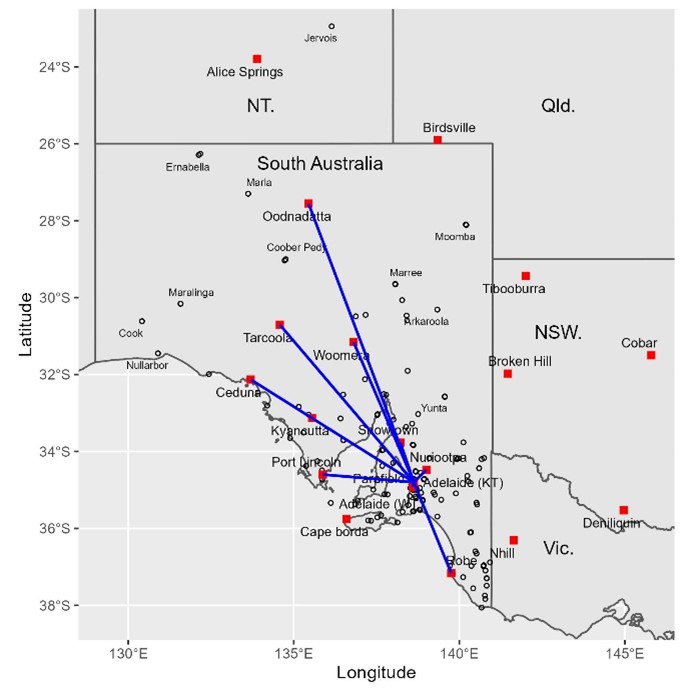
Data for Parafield airport (Bureau ID 23013) commence on 1 April 1939 but site-summary metadata does not provide coordinates for the site. Google Earth Pro shows the current Almos automatic weather station (AWS) is near the centre of the airport about 1 km south of the control tower at Latitude ‑4.7977, Longitude 138.6281. While data show a naïve trend of 0.31oC/decade (3.1oC/century) a gap in available data from 1955 to 1973 is unexplained. Due to step-changes before 1973 and in 1999, data are not homogeneous, nevertheless, together with other sites, Parafield was used to homogenise ACORN-SAT sites at Oodnadatta, Tarcoola, Woomera, Ceduna, Kyancutta, Port Lincoln, Nuriootpa, Adelaide (Kent Town) and Robe in 2011 (Figure 5).
Figure 5. The first (2011) iteration of ACORN-SAT used data for Parafield Airport, 15 km west of Adelaide, with other cross-correlated sites to homogenise ACORN-SAT sites at Oodnadatta (859 km distant), Tarcoola, Woomera, Ceduna (546 km), Kyancutta, Port Lincoln, Nuriootpa, Adelaide (Kent Town) and Robe. ACORN-SAT sites are indicated by red squares. Weather stations in South Australia having >20 years of data are indicated by open circles, some of which are named.
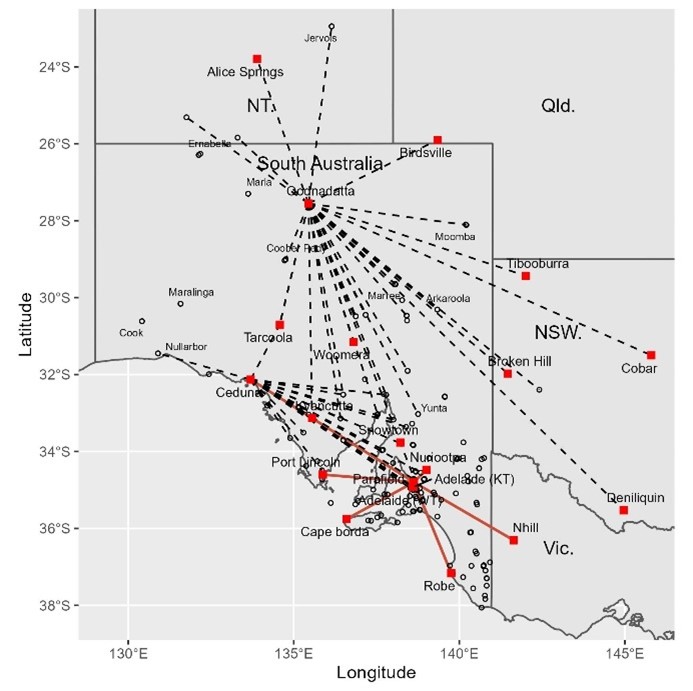
In contrast to Acorn-Sat v.1, the 2021 iteration (v2.2) used Parafield with other cross-correlated sites to only adjust Adelaide (Kent Town), Cape Borda, Port Lincoln, Robe, Kyancutta, Nhill and Ceduna (Figure 6). So, something in the method caused Parafield to be used for some sites in 2011, but not the same sites in 2021. Illustrating the complexity of the Bureau’s methods, radar graphs show location of the 24 sites used to homogenise Ceduna in 2021 and the 30 sites used for Oodnadatta. (The great circle distance from Oodnadatta to Deniliquin airports is 1263 km and to Cobar 1096 km.)
Figure 6. ACORN-SAT v.2 used Parafield airport data with other cross-correlated sites, to only homogenise ACORN-SAT sites at Adelaide (Kent Town), Cape Borda, Port Lincoln, Robe, Kyancutta, Nhill and Ceduna, which is a geographically less-dispersed suite compared to v.1. The radar plots locate the of 24 sites in total, used to homogenise ACORN-SAT data for Ceduna and the 30 sites used for Oodnadatta.
Homogenisation of Australia’s temperature record underpins the Australian government’s decarbonisation agenda including upheavals in energy supply networks, rapid increases in energy costs that will force energy-intensive industries offshore, and the destruction of habitats and despoiling of landscapes by wind turbines, solar panels and woody-weeds.
While true costs have not been revealed, the impact on future generations will be at a scale never envisaged by those advocating for change. While elites will accumulate wealth and power, those agitating on their behalf for climate justice and other paradoxical causes are laying the foundations for their own highly indebted, personally limiting Orwellian future. Without abundant, reliable, affordable energy and exports of minerals, coal and agricultural commodities to support orderly market-based transitions, including to nuclear power, Australia risks becoming a voiceless, crippled, heavily manipulated society devoid of a productive base.
Conclusions
The Bureau’s homogenisation methods lack rigor, replicability and quality control and are likely to result in trends that have nothing to do with the climate. Selection of comparator neighbouring datasets on the basis of first-differenced correlations axiomatically identifies those with parallel faults.
Use of reference series composed of data that are not homogeneous to detect and adjust changes in ACORN-SAT data has no scientific or statistical merit and should be abandoned.
An important link – find out more
The page you have just read is the basic cover story for the full paper. If you are stimulated to find out more, please link through to the full paper – a scientific Report in downloadable pdf format. This Report contains far more detail including photographs, diagrams, graphs and data and will make compelling reading for those truly interested in the issue.
Note: Line numbers are provided in the linked Report for the convenience of fact checkers and others wishing to provide comment. If these comments are of a highly technical nature, relating to precise Bomwatch protocols and statistical procedures, it is requested that you email Dr Bill Johnston directly at scientist@bomwatch.com.au referring to the line number relevant to your comment.
Dr Bill Johnston
25 November 2022
Note: Line numbers are provided in the linked Report for the convenience of fact checkers and others wishing to provide comment. If these comments are of a highly technical nature, relating to precise Bomwatch protocols and statistical procedures, it is requested that you email Dr Bill Johnston directly at scientist@bomwatch.com.au referring to the line number relevant to your comment.