Mean sea level change at Cooktown, Great Barrier Reef, Queensland
Dr Bill Johnston
Main points
- There is no evidence that melting glaciers, increasing levels of atmospheric CO2 or expansion of the oceans due to rising temperatures has caused sea levels to increase at Cooktown. Consequently, the likelihood that sea level will rise by 26 to 29 cm by 2030 as suggested by the IPCC is far-fetched.
- As trends measured by multiple tide gauges adjacent to the reef differ from satellite-based estimates, and time-lapse aerial photographs since the 1950s show no shoreward encroachment of tidal wetting fronts, satellite data should not be used in critical studies or to inform government policy.
- The El Niño Southern Oscillation exerts an overarching impact on fluctuations in sea level and other climate and environmental variables.
Background
The Great Barrier Reef Marine Park Authority (GBRMPA) claims that due to global warming, sea level is increasing and that the fastest rate of sea level rise is in the northern sector of the Reef. Further, the Intergovernmental Panel on Climate Change (IPCC) predicts sea level will rise by around 26 to 29 centimetres over the next 9-years (i.e., by 2030) and by 47 to 62 centimetres by 2080.
But is it true or is it just untrustworthy science?
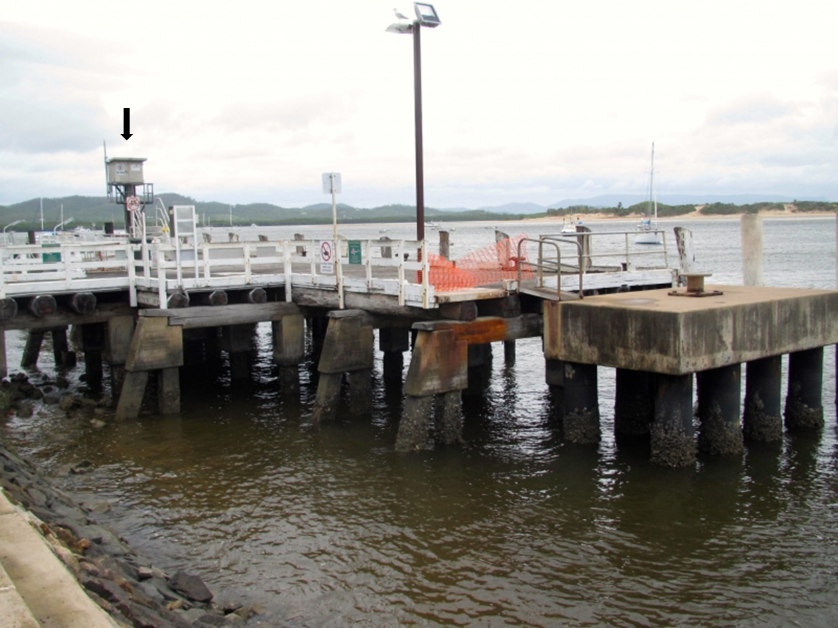
Rapid rates of sea level change should be evident in mean sea level (MSL) measured by tide gauges relative to the land, especially at Cooktown where Maritime Safety Queensland has operated an automatic tide gauge since January 1996 (Figure 1). Also, evidence of shoreline encroachment resulting from sea level rise should be obvious in time-series of aerial photographs available from Queensland Government archives since the 1950s and 1960s.

Figure 1. The Cooktown storm surge tide gauge (arrowed) located on the wooden-decked wharf prior to its restoration in 2015. (Photo 44740 from the Cultural Atlas of Australia.)
What we did
High-frequency (10-minute) tide gauge data was downloaded from the Queensland Government Open Data portal, aggregated into monthly averages and analysed using a technique that partitioned variation IN the data caused by influential covariables, from underlying impact variables that impacted ON the data-stream.
Aerial photographs taken in 1969, 1974, 1979, 1983, 1987, 1989, 1991, 1994 and high-definition Google Earth Pro Satellite imagery were also examined for signs of tidal encroachment at Cherry Tree Bay east of Cooktown across the peninsula.
What we found
The Bureau of Meteorology Southern Oscillation Index (SOI) was the most influential of a range of climate and environmental variables that affected MSL. Rainfall and rainfall two months previously (RainLag2) also explained a statistically significant but small portion of MSL variation. Having accounted for those covariables, extraneous factors impacting on the data-stream caused step-changes in 1997, 2009 and 2015.
Following Tropical Cyclone Justin in March 1997, a major dredging campaign removed 108,000 m3 of accumulated sediment from the harbour floor, which caused the wharf supporting the tide gauge to settle about 40 mm into the bed of the river by January 1998. Dredging of more sediment in 1999 (26,000 m3) did not affect the gauge. However, in March 2009 it settled a further 37 mm probably as a result of disturbances caused by TC Ellie (30 January to 4 February 2009) and TC Hamish (4 to 11 March 2009). The harbour was dredged again following TC Ita in 2014 (60,000 m3), then in January 2015 the former wooden wharf that supported the tide gauge was strengthened and re-decked with a new composite material capable of allowing small trucks to load and unload supplies (https://www.wagner.com.au/main/our-projects/cooktown-wharf/). Dredging and refurbishment caused the tide-gauge to settle a further 32 mm. Step-changes underlying the data-stream show the gauge is not well-secured to the harbour floor.
The highly significant step-changes (P <0.001) totalling 109 mm (SEM 9.4 mm) accounted for all the apparent MSL trend. There is no evidence therefore that sea level is rising in the northern sector of the Reef. The IPCC prediction that sea levels will increase globally by 26 to 29 cm by 2030 is an unlikely scenario.
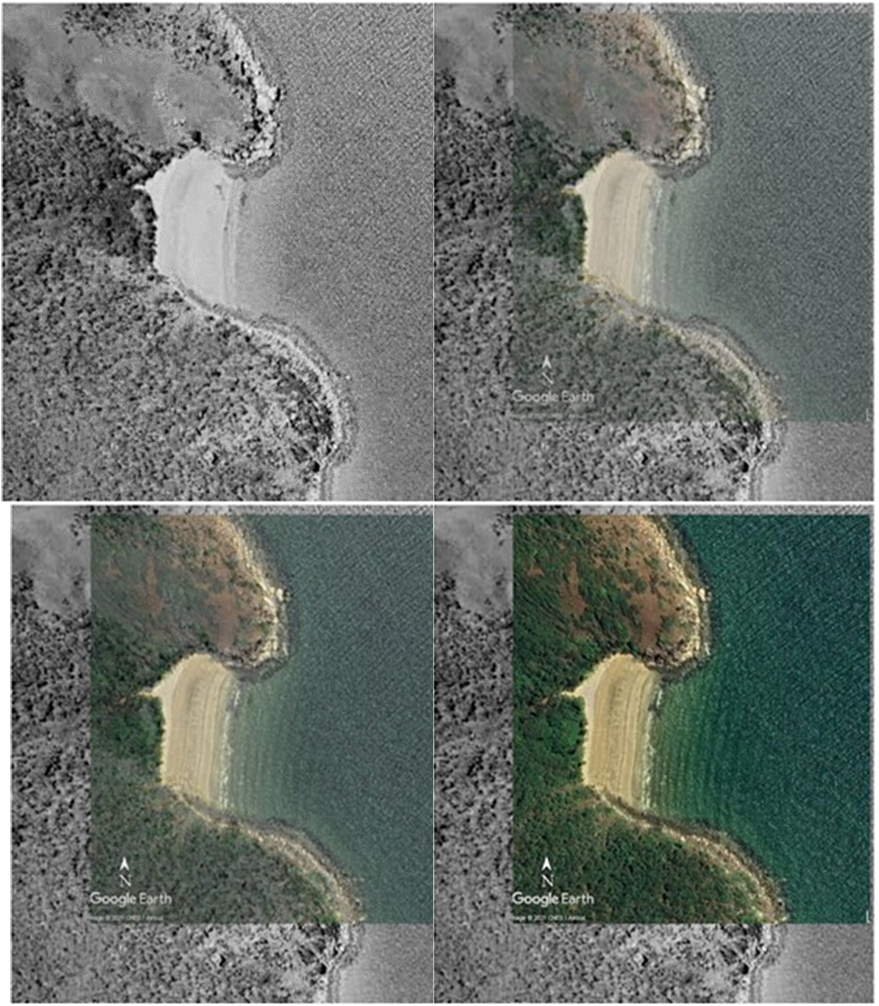
A Queensland Government aerial photograph taken on 11 September 1969 was re-scaled and oriented so features across the peninsula east of Cooktown including the well-defined Cherry Tree Bay and associated rocky headlands can be directly compared as an overlay on a Google Earth Pro satellite image taken on 16 September 2018.
Marked where they intersect the headlands, tidal wetting fronts are the same along the low-gradient beach. Littoral zones around the headlands that define inter-tidal habitats also directly align. The same shoals and individual shore-line rocks, the small watercourse draining to the beach: all the same. There is no evidence of tidal encroachment and therefore no evidence that sea levels have materially changed over the intervening 49-years (Figure 2).
What we conclude
Satellite data depended upon by IPCC do not stack-up with tide gauge data or aerial photographs taken between 1969 and 1994 compared with high-definition Google Earth Pro Satellite imagery of the same sandy-beach.
It seems that while CSIRO et al. can model sea level relative to some point at the centre of the earth with mm/year precision using satellites traversing the same patch of heaving ocean every 20-days or so, they and other oceanographers and elite climate scientists lack the skills to analyse tide gauge records or interpret aerial photographs they can freely download from the internet.
Satellite data upon which speculation relating to sea level rise depends, is pre-loaded with trend and should not be used for critical studies, for spreading alarm or for informing government policy. It is a ridiculous notion that sea levels will increase by almost 300 mm during the next 9-years.

Figure 2. Aerial photograph of Cherry Tree Bay, east of Cooktown taken on 11 September 1969 overlaid on Google Earth Pro (GEP) Satellite image for 16 September 2018; upper-left, GEP opacity 0%, 50%; lower-left 75%, 100%. Tidal wetting fronts, littoral zones, rocks and shoals show no encroachment or change in exposure due to rising sea levels over the intervening 49-years.
Two important links – find out more
First Link: The page you have just read is the basic cover story for the full paper. If you are stimulated to find out more, please link through to the full paper – a scientific Report in downloadable pdf format. This Report contains far more detail including photographs, diagrams, graphs and data and will make compelling reading for those truly interested in the issue.
Click here to download the full paper with photos graphs and data
Second Link: This link will take you to a downloadable Excel spreadsheet containing a vast number of Data points for the Cooktown tide gauge and which was used in the analysis of the sea level situation at Cooktown to support the Full Report.
Click here to access full table of data supporting the Full Report
Dr Tim Ball – Historical Climatologist
Book: ‘The Deliberate Corruption of Climate Science’
Book: ‘Human Caused Global Warming, the Biggest Deception in History’
https://www.technocracy.news/dr-tim-ball-on-climate-lies-wrapped-in-deception-smothered-with-delusion/
https://www.youtube.com/watch?v=tPzpPXuASY8
Herewith my unpublished letter to The Australian. I have since discovered one error – 40,000 odd delegates attended this farce.
The Editor The Australian 3Nov21 Dear Ed
In October 1971, the first lumps of coal clattered into the hold of the first Japanese bulk carrier to berth at Hay Point. I was there. It was 1.30 am after another long day. Since then after 50 years of hard yakka by the many who have worked, prospered and spread that prosperity, over 1 billion tonnes of top quality metallurgical coal has been exported from that terminal. Vast new deposits are still being discovered in the hinterland. If the average price of that coal was $100 per tonne, that would just be enough to pay for some French submarines designed to run on recycled French fries cooking oil. Ah well, easy come, easy go.
In the past 50 years, the rise in sea level at Hay Point has been indiscernible, as has any increase in surface land temperatures at either Mackay or Tokyo. The Great Barrier Reef looks as healthy as ever. Do any of the 25,000 delegates to the Conference Of Parties, COP26, in Glasgow know why they are there – apart from party? (174 words)
Bill, your work on SL has been meticulous. I only hope that it gets as far as the BoM and the politicians.