Part 2: Issues affecting performance
Dr. Bill Johnston[1]
Synopsis
AWS data for Cape Leeuwin don’t reflect the weather and are unlikely to be useful for detecting trends and changes in the climate.
Background
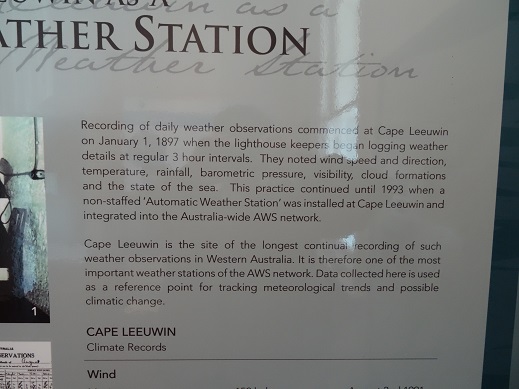
Being the longest single-site temperature and rainfall record in Western Australia, the automatic weather station (AWS) at Cape Leeuwin is regarded as one of the most important in the Bureau of Meteorology’s AWS network (Figure 1). However, situated at the southwest extremity of the continent, of all the Bureau’s weather stations, it is also one of the most exposed.

Figure 1. Signage at Cape Leeuwin explaining the importance of the automatic weather station.
Cape Leeuwin’s rugged rocky headland marks the junction of the Indian and Southern oceans. Cold, sub-polar low-pressure systems sweep in during winter and the sub-tropical high-pressure belt squeezes them south in summer. As there are no obstacles south or west to break-up or divert the low-pressure troughs, associated frontal systems and often gale-force winds; Cape Leeuwin experiences some of the most intense weather systems affecting mainland Australia. (BJ photo.)
While the general circulation moves from west to east at a rate of about 650 km/day, the mid-latitude belt of high-pressure shifts from around -40o Latitude (the Latitude of Flinders Island in Bass Strait) to around -30o Latitude (about the Latitude of the NSW-Queensland border) in April and back again around early October. This N-S seesaw, which follows the sun, is the reason Australian climates are strongly seasonal (moist during winter in the south when low pressure systems prevail and moist in the north during summer due to intrusions of the tropical monsoon and vice versa).
Weather-watches know that when the sub-tropical ridge settles a few degrees further south in winter, say south of Dubbo (-32o Latitude), approaching low pressure systems are also forced south and southern Australia is drier than normal and vice versa. Similarly, the position of the high-pressure ridge in summer determines the southern reach of the monsoon.
Observing the weather in situations that are open and exposed, subject to wild fluctuations, extremely strong winds and heavy seas is a challenging occupation, especially when manual observations were made at regular intervals both day and night. Wind was so strong and unrelenting that it shook the Stevenson screen, reset thermometers and resulted in breaks in their mercury and alcohol columns (Figure 2). It also drove mist, fog, rain and sea-spray into the screen, wetting instruments and interfering with measurements which are assumed to be dry-bulb.

Figure 2. A Fahrenheit meteorological minimum temperature thermometer showing breaks in the alcohol column (adjacent to the 68o, 73o and 75oF indices). Drawn down by the meniscus (sitting at 106.8oF) the metal bar marks the lowest reading of the day (97.3oF in this case). Not shown is a large vapour break in the lower stem of the thermometer, which after four decades of storage rendered it unserviceable. The interval scale in the photograph is magnified by about 50% compared to the actual scale, which was about 2.5 mm (1/10th of an inch) per interval. (BJ photo.)
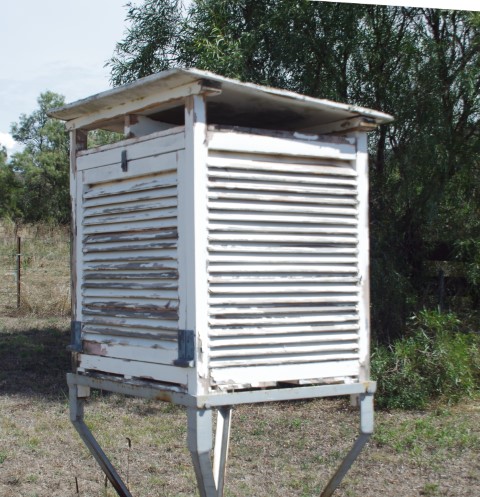
Minimum temperature observations were noted as problematic in 1916, but the problem was not specified. The original Stevenson screen was an ‘old observatory pattern’, which by 1926 had been lowered to within 2 feet of the ground apparently to reduce wind-shaking. A decade later in June 1936 a new screen was installed; but was it in the same place or did the site move? Then no news about the state of the screen or the condition of the instruments for 28 years – until July 1964, when it was reported that the door, which faced south into the weather was damaged. No news also for the 14 years before the site moved in October 1978. Perhaps by then the screen was neglected like the one in Figure 3.
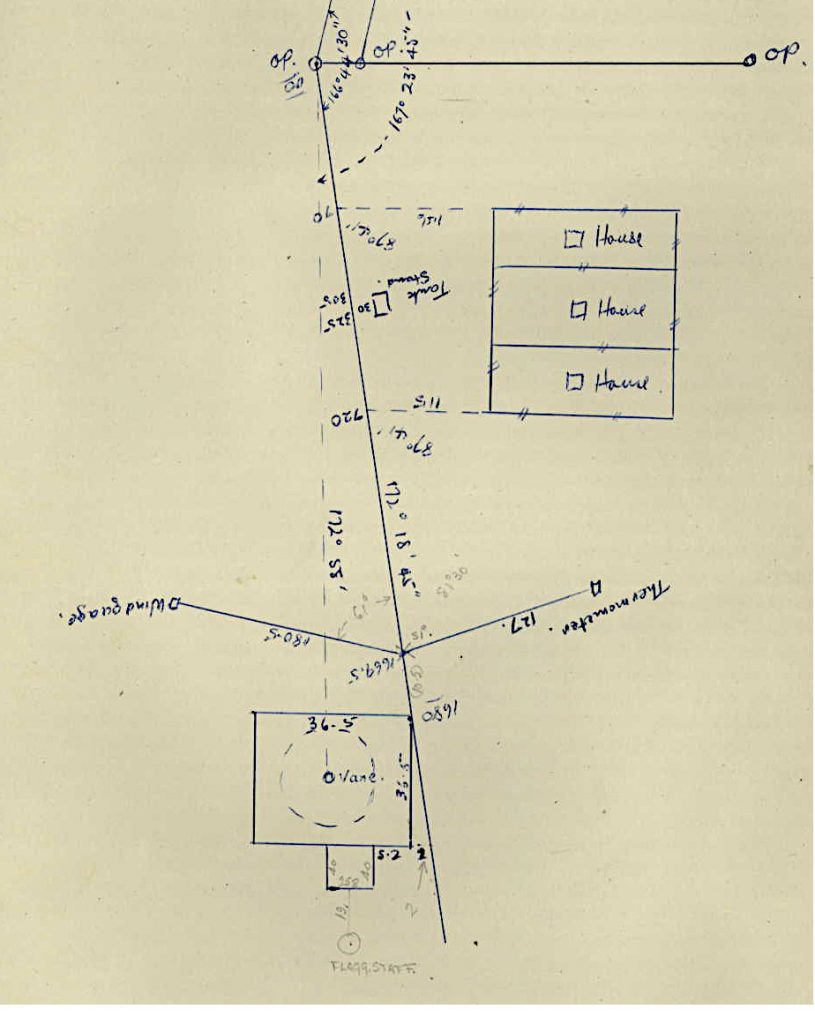
Despite repeated assurances that Australian Climate Observations Reference Network – Surface Air Temperature (ACORN-SAT) sites like Cape Leeuwin were well researched and peer reviewed, metadata is poor to non-existent. Peer-reviewers did not investigate if documentation was adequate, or if sites were well maintained and data were fit-for-purpose. It is not that long ago that the site moved in October 1978 but site summary metadata miss-specified its previous location and did not report the move. Apparently the Bureau had no records or photographs or files. However, a 1950s plan in a file at the National Archives of Australia unequivocally showed the ‘wind gauge’ northwest of the lighthouse and the Stevenson screen northeast (Figure 4) where it was also visible in photographs taken in 1975.

Figure 3. A neglected 230-litre screen no longer in use at an agricultural research centre in NSW. (BJ photo.)
The importance of metadata cannot be understated. Scientists say that if sites and instruments remained the same, changes in the data are attributable to the climate. Ignoring (or not documenting) changes that happened or adjusting data for changes that had no impact (or using unspecified, unreplicable statistical tests to make adjustments) is one way to create pre-determined trends. Subjective homogenisation methods based on faulty metadata are unscientific; they result in trends that have nothing to do with the climate and should be abandoned.

Figure 4. Page 104 from file ‘Cape Lewin (Leeuwin) – transport lighthouse’ National Archives of Australia Barcode 1929975; showing location of the wind vane (anemometer) and Stevenson screen, which was about 38 m east of the path.
Using Cape Leeuwin as a case study, the physically based reference frame outlined and demonstrated in Part 1 of the series is applied to the problem of exploratory data analysis (EDA) – the rapid assessment of AWS datasets used to construct daily temperature maps and to homogenise ACORN-SAT data used to calculate Australia’s warming. The approach was developed from previous original research published on http://www.bomwatch.com.au In line with the theme of “Are Australia’s automatic weather stations any good?” this paper outlines an EDA methodology that can be applied by climate scientists to investigate the fitness of individual datasets for determining trend and changes in the climate.
The approach uses Pearson’s linear correlation coefficient (r) to measure the strength, significance and sign (+ or -) of the association between mean maximum temperature (Tmax) and its expected deterministic covariable, rainfall; and non-parametric LOWESS regression (LOcally Weighted Scatterplot Smoothing) to visualise the shape of the association, the spread of values about the line and identify outliers relative to 95% bootstrapped confidence intervals for the fit.
Leaving aside problems evident in data from 1907, which were also investigated; the AWS, which commenced operating in February 1993, was moved from a relatively sheltered position between two sheds to an up-draft zone closer to the 13 m drop-off above the ocean in April 1999. Corresponding with the move, rainfall-catch abruptly declined by 26%. Mean Tmax at the new site was biased high relative to pre-1993 manual data and although not significant, Tmax implausibly increased with rainfall. Seven of 27 datapoints were identified as outliers including 2011 (21.20oC) and 2012 (21.13oC), which were an unlikely 1.61oC and 1.53oC higher than pre-AWS Tmax (19.6oC).
It was concluded that as AWS data don’t reflect the weather they are unlikely to be useful for detecting trends and changes in the climate.
An important link – find out more
The page you have just read is the basic cover story for the full paper. If you are stimulated to find out more, please link through to the full paper – a scientific Report in downloadable pdf format. This Report contains far more detail including photographs, diagrams, graphs and data and will make compelling reading for those truly interested in the issue.
Click here to download the full paper including photographs and tables of data
(In line with our open-data policy, datasets used in the study are provided in Appendix 2 (pp. 11-16).)
We also welcome comments on the methodology.
[1] Former NSW Department of Natural Resources research scientist and weather observer.