Are Australia’s automatic weather stations any good?
Part 3: Non-climate biases
Dr. Bill Johnston[1]
(Read- time 6 minutes)
Historic climate data collected to monitor and describe the weather are notoriously problematic to use in bolt-on experiments that aim to determine trend and change in the climate. The instruments used and conditions under which observations were made are rarely known and it is the earliest data that form the baseline for establishing long-tern trend. Pre-1940 data for Rutherglen Research (Bureau ID 082039) for example were observed at a site in a wheat paddock 1-km north of the current site; thermometers were most likely exposed in a small metal-roofed Stevenson screen not a 230-litre standard one and according to Simon Torok (1996)[2] observations from 1912 were combined with those from the Post Office (about 12 km away) to form a composite series. Metadata does not mention where the original site was or for what period data were combined. Cross-referenced by Torok’s notation for May 1939 that the screen “opens to the west”, a step-down in average maximum temperature (Tmax) in 1941 of -0.71oC indicated the screen was replaced in 1940 and that the previous screen was biased-high. For data up to 1966 the step-change resulted in a spurious negative trend that was unrelated to the climate.
Background
- Marketing campaigns by taxpayer-funded institutions, universities, the Australian Academy of Science, the ABC, The Guardian, the Nine network (ie, the former ‘Fairfax’ press) and The Conversation; together with ardent climate catastrophists have groomed the public relentlessly for nearly three decades to believe that temperature is bound to increase in-line with CO2. The expectation of ‘trend’ has distracted us into questioning whether temperature is increasing at 0.5oC/century or 1.5oC/century, rather than investigating if real trend exists (i.e. that trend in data is spuriously due to something else).
- Data-fiddling hardly describes the fraught process of creating homogenised ACORN-SAT datasets (Australian Climate Observations Reference – Surface Air Temperature) used by CSIRO in their State of the Climate reports and those used by the Bureau of Meteorology to create graphs and pictures for recent Bushfire Royal Commissions, inquiries and inquests. In addition area-weighted daily temperatures that form the gridded AWAP (Australian Water Availability Project) dataset are not corrected for individual site biases. With its hard-wired AWS network, the Bureau and its colleagues in CSIRO, the University of NSW and others like James Cook, Monash, Melbourne and Woollongong universities are able to create and market whatever climate they want the community to believe.
- Winding back the blinds to let some light in takes an enormous amount of effort. It’s impossible to have anything published in a scientific journal that rocks their boat for example. It is unarguable that the Bureau and friends have re-written Australia’s climate history – the droughts, floods, bushfires and extremes that have fashioned the country, in favor of their narrative which they fervently protect. For instance, although the community is led to believe climate change threatens the survival of the Great Barrier Reef, no such change or warming is detectable in climate datasets for sites adjacent to the Reef. The story was made up so handpicked ‘expert’ committees running the agenda and WWF-related campaigners like the Climate Council and Farmers for Climate Action mislead everyone. For a scientist its disheartening that while agricultural industries are blamed and pushed to the brink, billions of taxpayer dollars are being spent to “save the Reef” from a problem that doesn’t exist.
Investigating automatic weather stations
Starting with raw daily maximum temperature data (Tmax) from Climate Data Online, statistical code that derives annual averages and other attributes, and as much metadata as can be found, we at www.bomwatch.com.au/ recently set out to investigate biases and other problems in Australia’s automatic weather station (AWS) network. Manual stations that report their data every morning are always 1-day late and since they were networked and integrated across the nation, temperature and rainfall maps used by news networks and temperatures reported through the day are produced using AWS data alone. So it is very important to have confidence that the technology is sound and that the Bureau’s data handling methods are beyond reproach.
Our AWS-project was introduced using Amberley RAAF as the case study and six widely dispersed airport sites as blind-study replicates. Aerial photographs, maps and plans and other metadata showed unequivocally that like at Cairns, Townsville and Rockhampton, homogenisation attributed the effect of site changes to the climate.
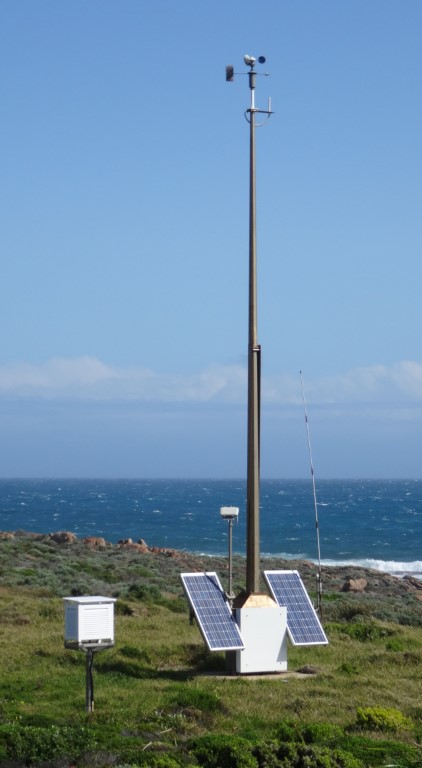
Metadata for Cape Leeuwin was also sparse and incomplete. The original site near the lighthouse was pinpointed using maps and photographs, which also confirmed that a large standard 230-litre screen was in use before the site moved north in October 1978. The extreme environment affected the data – wind-shaking damaged or caused thermometers to reset; while fog, mist, rain, and sleet driven into the screens by strong winds affected observations, which are assumed to be dry-bulb. Moving the AWS beside the drop-off to the ocean in April 1999 reduced rainfall-catch by 26% (Figure 1). Allegedly one of the most important sites in the AWS network, data for Cape Leeuwin including AWS data were not useful for determining long-term trend or change.

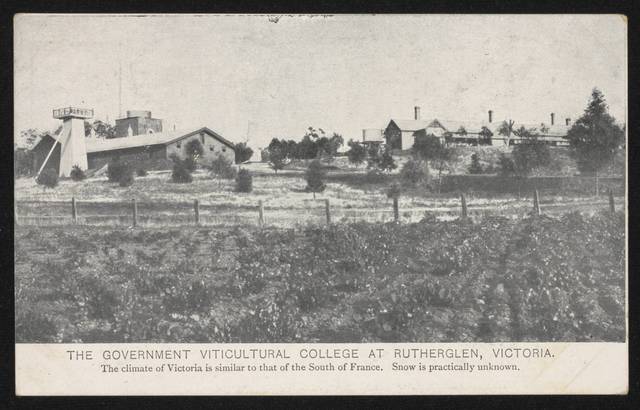
The Rutherglen Institute in northeastern Victoria started life in 1895 as a viticulture college (Figure 2). Early research was instrumental in identifying insect (Phylloxera) resistant vines and rootstock.

Due to Government antipathy the college almost failed. Proposals included turning it into a consumptive sanatorium (for TB suffers), dispensing with staff and selling it off or making it a boarding school for educating neglected children and those of local farmers in the science and practice of agriculture.

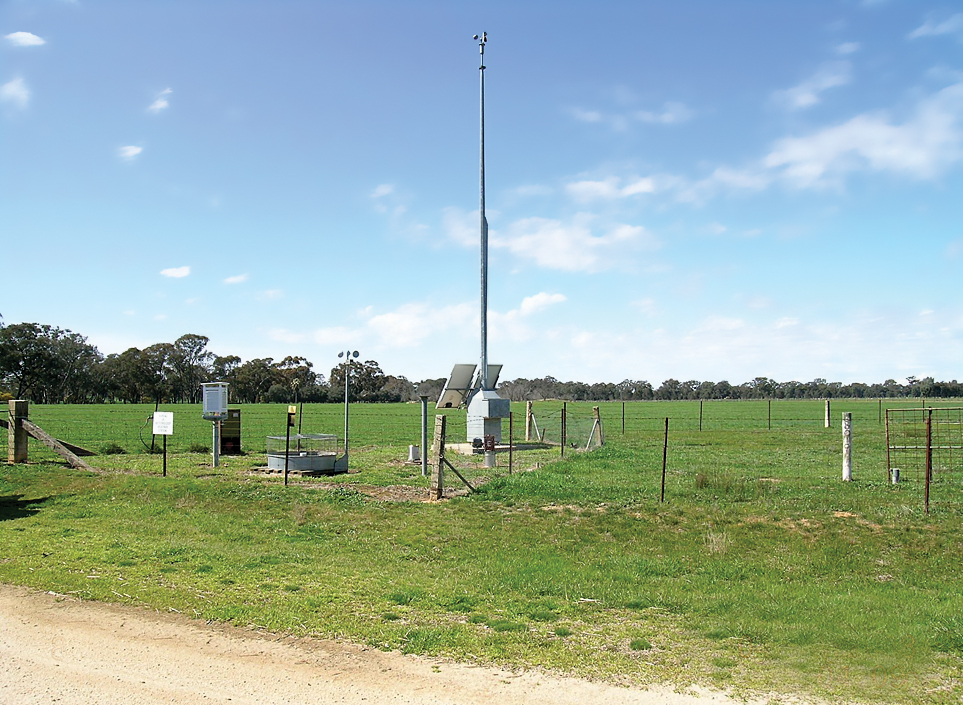
Analysis of Rutherglen Tmax since 1912 found no trend or change attributable to the climate. Despite repeated assurances that ACORN-SAT sites have been thoroughly researched metadata was misleading and incomplete. For instance although the site moved twice during the period; no metadata was available from December 1949 until May 1975 (26 years). A 1941 aerial photograph pinpointed the original site while objective statistical analysis provided unequivocal evidence in both time and rainfall domains that trend was due to site changes not the climate. Analysis was supported by close examination of ten, AWS-only datasets of sites used to homogenise Rutherglen ACORN-SAT. Those sites also showed no trend or change attributable to the climate.
Picking and choosing changepoints and using up to 40 highly correlated comparator datasets to make adjustments has no scientific or statistical merit. The process is demonstrably biased and should be abandoned. Peer review in 2012 ignored obvious problems while the Technical Advisory Forum that was supposed to provide overview of the homogenisation process over three years to 2017 failed to do its work (http://media.bom.gov.au/releases/379/bureau-welcomes-release-of-technical-advisory-forum-report/)
If there is no evidence of increasing trends in individual datasets then the Bureau and CSIRO’s claims that temperature has increased since the 1950s are baseless. Instruments and observers change; data are imprecise; site control is ad hoc – a garden over there, a new shed or concrete path; mowing the grass or not, or using herbicide introduces artificial changes in datasets. Due to infrequent maintenance screens also deteriorate, paint flakes-off, dust and grime accumulates, wasps build nests on sensor-probes and ignoring changes in nearby land-use introduces non-climatic bias which on warm-days may be as high as 1 to 2oC.
An important link – find out more
The page you have just read is the basic cover story for the full paper. If you are stimulated to find out more, please link through to the full paper – a scientific Report in downloadable pdf format. This Report contains far more detail including photographs, diagrams, graphs and data and will make compelling reading for those truly interested in the issue.
Click here for a full paper showing air photos, graphs, tables of data and relevant information
For historic datasets used as baselines it’s even worse particularly if they don’t know where the original site was or what it was like; and for ACORN-SAT sites such as Cairns, Townsville, Rockhampton, Amberley, Cape Leeuwin and Rutherglen where they failed to undertake the site research they said they did. By failing in their due diligence, the Bureau and others may have misled the Minister to whom they ultimately report and misled the public to whom they own a duty of care.
Research on long-term data and automatic weather stations is continuing.
[1] Former NSW Department of Natural Resources research scientist and weather observer.
[2] Torok SJ (1996). Appendix A1, in: “The development of a high quality historical temperature data base for Australia”. PhD Thesis, School of Earth Sciences, Faculty of Science, The University of Melbourne.